
Thank you for the likes, shares and follows. Really appreciate!
_________________________________________________________
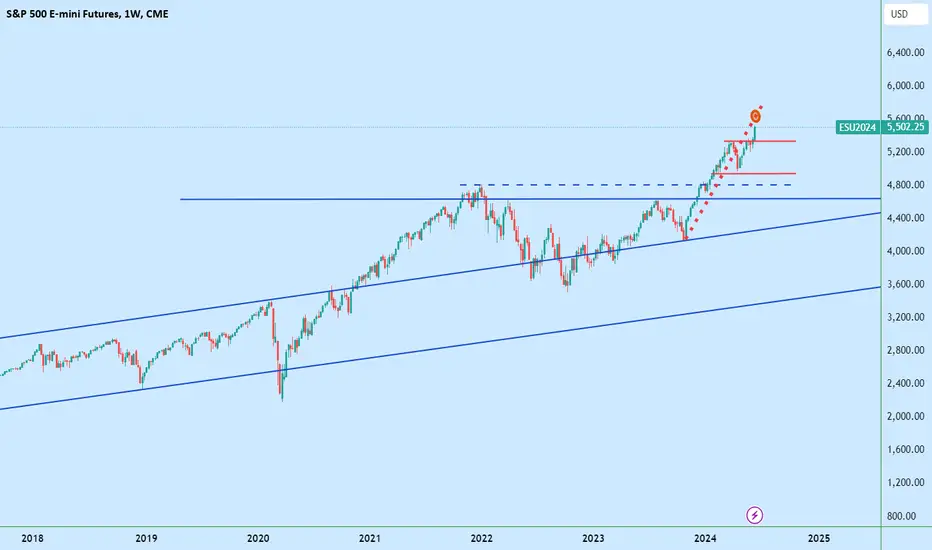
This is a zoome out from the latest analysis of the ES1! Mini S&P500 Market.
A little bit adjusted with some interesting points to consider.
in the upper side we potentially won't be surprised in proach futrue see the price rising to $5637.5.
It is time probably to think at holding long short positions as there are some potential lower price point interesting to consider:
- The red horizontal line range area
- And lower there the blue dashed horizontal line
next week candle could probably do the same as this week but in the short side.
Where is the price going and what is the upper side limit? We don't know, we can only make some assumptions based on the technical analysis of the chart.
The issue is that we see that some historicl correlations are not being respected anymore.
_________________________________________________________
This is a zoome out from the latest analysis of the ES1! Mini S&P500 Market.
A little bit adjusted with some interesting points to consider.
in the upper side we potentially won't be surprised in proach futrue see the price rising to $5637.5.
It is time probably to think at holding long short positions as there are some potential lower price point interesting to consider:
- The red horizontal line range area
- And lower there the blue dashed horizontal line
next week candle could probably do the same as this week but in the short side.
Where is the price going and what is the upper side limit? We don't know, we can only make some assumptions based on the technical analysis of the chart.
The issue is that we see that some historicl correlations are not being respected anymore.

関連の投稿
免責事項
これらの情報および投稿は、TradingViewが提供または承認する金融、投資、取引、またはその他の種類の助言もしくは推奨であることを意図したものではなく、またこれらに該当するものでもありません。詳細は利用規約をご覧ください。
免責事項
これらの情報および投稿は、TradingViewが提供または承認する金融、投資、取引、またはその他の種類の助言もしくは推奨であることを意図したものではなく、またこれらに該当するものでもありません。詳細は利用規約をご覧ください。