
The Same Price Direction Can Tell Two Different Stories
With the US midterm elections scheduled for November 3, 2026, traders are approaching another significant event on the economic and financial calendar. Although the outcome of the elections and the subsequent market reaction remain uncertain, periods surrounding major scheduled events provide opportunities to examine how different markets respond to changing expectations.
Gold and the S&P 500 offer an interesting comparison.
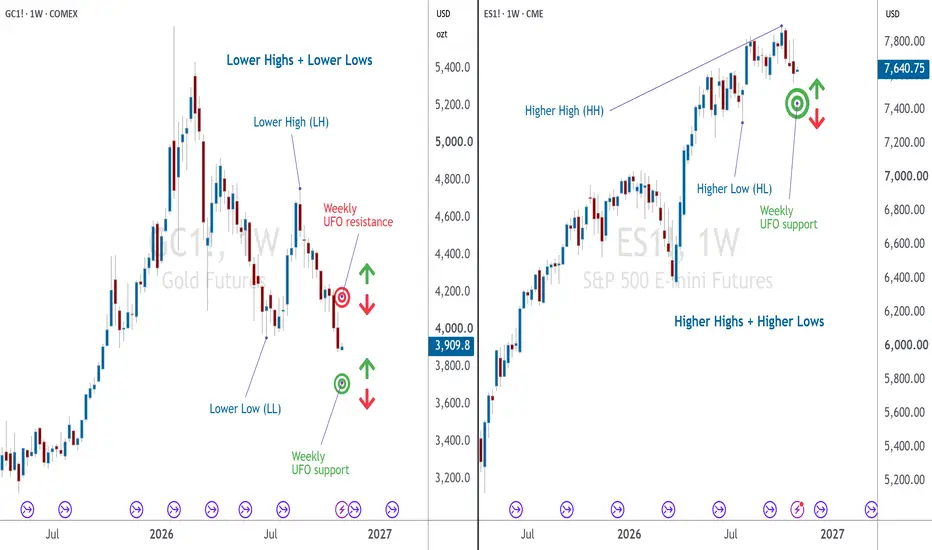
As illustrated by the accompanying weekly charts, both markets have recently experienced downward price movements. However, looking beyond their immediate direction reveals an important difference.
Gold futures (GC1!) have developed a bearish weekly structure characterized by lower highs and lower lows. Meanwhile, E-mini S&P 500 futures (ES1!) continue to exhibit a broader bullish structure, despite their recent correction.
This contrast illustrates an important principle of technical analysis: two markets can move in the same direction without presenting the same technical conditions.
Why Market Direction and Market Structure Are Different
Price direction describes where a market is moving over a particular observation period. Market structure examines how successive significant highs and lows relate to one another.
An upward market structure is typically characterized by higher highs and higher lows. Conversely, lower highs and lower lows generally indicate a downward structure.
This distinction becomes particularly important when markets experience sharp price movements.
A declining market may be undergoing a temporary correction within an established uptrend. Alternatively, the same downward movement could represent a continuation of an existing bearish trend.
The difference is not necessarily visible from the latest candlestick alone.
Instead, examining the sequence of significant swing highs and lows can provide a more complete picture of the underlying market environment.
Gold: A Bearish Structure With Resistance Overhead
The weekly Gold futures chart provides an example of an established bearish structure.
Following its earlier peak in 2026, Gold experienced a substantial decline. Subsequent recovery attempts failed to establish new highs, while later selling pressure produced progressively lower prices.
The resulting sequence of lower highs and lower lows illustrates how bearish market structure develops.
Based on the November 1 chart, Gold futures were trading around $3,898.9 per troy ounce.
Two significant price areas deserve attention:
The resistance area represents a region where renewed selling pressure could become relevant if prices recover.
The support area identifies a lower region where the market's response may provide additional information about the persistence of the bearish structure.
Importantly, neither area guarantees a reversal.
For example, an upward reaction from support could initially represent a countertrend recovery rather than the beginning of a sustained bullish reversal.
Likewise, an upward breakout through resistance would not automatically establish a new bullish trend. Further evidence, including changes in the sequence of significant highs and lows, would be needed.
S&P 500: A Correction Within a Broader Bullish Structure
The weekly E-mini S&P 500 futures chart presents a different situation.
Despite the recent decline, the broader chart continues to exhibit a recognizable sequence of higher highs and higher lows.
This suggests that the current downward movement may still be interpreted as a correction within a larger upward structure, unless subsequent price action provides evidence of structural deterioration.
Based on the November 1 chart, ES futures were trading around 7,614.
The principal UFO weekly support area is located between 7,324.00 and 7,563.50.
Interestingly, the latest weekly low reached 7,558.25, marginally entering the upper boundary of this support area before the displayed price recovered above it.
This illustrates another important distinction: entering a support zone is not necessarily equivalent to breaking it.
A temporary penetration may be followed by a recovery, while sustained trading below the zone could indicate a more significant change in market conditions.
The response to the entire support area, rather than a single price level, is therefore central to evaluating the broader structure.
Three Possible Reactions at Support and Resistance
Support and resistance should be treated as areas where traders evaluate market behavior rather than locations that automatically generate trading signals.
Three general scenarios are particularly relevant when volatility increases.
These scenarios are not mutually exclusive over time. A market may initially reject a zone, subsequently break through it, and later retest the same area from the opposite direction.
Consequently, the quality of confirmation, the broader market structure, and the distance to the next relevant price area all matter.
Illustrative Scenario 1: A Resistance Rejection in Gold
Consider a hypothetical situation in which Gold recovers toward its weekly resistance area between $4,091.2 and $4,242.3.
Rather than assuming that reaching resistance will produce a reversal, the analytical process would involve observing whether price action demonstrates renewed selling pressure.
For illustration, suppose a rejection develops and the following parameters are considered:
The target is positioned slightly above the identified weekly support area, acknowledging that an opposing support zone could interrupt a downward movement.
A sustained breakout above $4,242.3 would weaken the original resistance-rejection interpretation. The hypothetical stop at $4,250 provides a predefined exit level, although execution at that exact price cannot be guaranteed.
The scenario illustrates how an existing bearish structure, a significant resistance area, and an opposing support level can be combined into a conditional risk-management framework.
It does not imply that Gold will reach the proposed entry or target.
Illustrative Scenario 2: A Support Reaction in the S&P 500
Now consider the S&P 500.
Unlike Gold, its broader weekly structure remains bullish.
Suppose ES revisits the upper portion of the weekly support area and subsequently demonstrates evidence of renewed buying pressure.
A hypothetical scenario might use:
The stop is positioned beneath the weekly support area, while the hypothetical target is near the recent upper price region.
Although the broader structure supports considering a bullish continuation scenario, the relatively modest reward-to-risk relationship raises an important question.
Is the potential distance to the target sufficient relative to the distance required for structural invalidation?
This illustrates why identifying support does not automatically establish an attractive hypothetical setup.
A confirmed breakdown beneath 7,324 would challenge the bullish interpretation associated with that support area. A subsequent failed retest from below could instead support an alternative bearish continuation scenario.
Contract Size, Margin, and Risk
Futures contract specifications are essential when translating hypothetical price movements into dollar exposure.
Standard Gold futures (GC) represent 100 troy ounces, while Micro Gold futures (MGC) represent 10 troy ounces.
Consequently, a $1 movement in the quoted Gold price corresponds to $100 per GC contract or $10 per MGC contract.
For the illustrative Gold scenario, the $150 distance between entry and stop therefore represents:
Similarly, E-mini S&P 500 futures (ES) have a multiplier of $50 per index point, compared with $5 for Micro E-mini S&P 500 futures (MES).
The illustrative 250-point stop distance in the ES scenario represents:
These calculations exclude transaction costs, slippage, and potential gaps. Actual losses may exceed the amounts calculated from the hypothetical stop distances.
Margin requirements must also be distinguished from trade risk.
Currently, margin estimates are set as ~$20,200 for GC, $2,020 for MGC, $25,960 for ES, and $2,596 for MES.
These are approximate margin estimates. Exchange performance-bond requirements can change with market conditions, and applicable initial margin, maintenance margin, and broker requirements should be checked independently.
A margin deposit is not the maximum amount that can be lost on a futures position.
Managing Uncertainty Around Major Events
The possibility of increased volatility introduces additional considerations.
Prices can move rapidly through previously established levels. A breakout may reverse before confirmation develops, while a stop order may execute at a different price from the intended level.
Traders evaluating such conditions may therefore consider whether to wait for additional confirmation, reduce hypothetical position size, or avoid situations where the required stop distance exceeds their predefined risk limits.
The important principle is that market structure provides context, but risk management determines whether a particular scenario is compatible with the trader's constraints.
Conclusion: Read the Structure, Not Just the Headlines
The approaching US midterm elections provide a timely backdrop for comparing Gold and the S&P 500, but the educational lesson extends far beyond any single event.
Both markets have recently moved lower.
Gold exhibits a bearish weekly structure, with resistance overhead and support beneath current prices.
The S&P 500, meanwhile, retains a broader bullish structure while correcting toward an established support area.
These differences illustrate why price direction alone is insufficient to characterize market conditions.
Whether a significant zone produces a rejection, a confirmed breakout, or a false breakout, the analytical process remains the same: evaluate the broader structure, identify relevant price areas, consider alternative outcomes, and define the associated risk.
The objective is not to predict how markets will react to a particular headline.
It is to develop a consistent framework for interpreting their behavior.
Data Consideration
When charting futures, the data provided could be delayed. Traders working with the ticker symbols discussed in this idea may prefer to use CME Group real-time data plan on TradingView: tradingview.com/cme - This consideration is particularly important for shorter-term traders, whereas it may be less critical for those focused on longer-term trading strategies.
General Disclaimer
The trade ideas presented herein are solely for illustrative purposes forming a part of a case study intended to demonstrate key principles in risk management within the context of the specific market scenarios discussed. These ideas are not to be interpreted as investment recommendations or financial advice. They do not endorse or promote any specific trading strategies, financial products, or services. The information provided is based on data believed to be reliable; however, its accuracy or completeness cannot be guaranteed. Trading in financial markets involves risks, including the potential loss of principal. Each individual should conduct their own research and consult with professional financial advisors before making any investment decisions. The author or publisher of this content bears no responsibility for any actions taken based on the information provided or for any resultant financial or other losses.
With the US midterm elections scheduled for November 3, 2026, traders are approaching another significant event on the economic and financial calendar. Although the outcome of the elections and the subsequent market reaction remain uncertain, periods surrounding major scheduled events provide opportunities to examine how different markets respond to changing expectations.
Gold and the S&P 500 offer an interesting comparison.
As illustrated by the accompanying weekly charts, both markets have recently experienced downward price movements. However, looking beyond their immediate direction reveals an important difference.
Gold futures (GC1!) have developed a bearish weekly structure characterized by lower highs and lower lows. Meanwhile, E-mini S&P 500 futures (ES1!) continue to exhibit a broader bullish structure, despite their recent correction.
This contrast illustrates an important principle of technical analysis: two markets can move in the same direction without presenting the same technical conditions.
Why Market Direction and Market Structure Are Different
Price direction describes where a market is moving over a particular observation period. Market structure examines how successive significant highs and lows relate to one another.
An upward market structure is typically characterized by higher highs and higher lows. Conversely, lower highs and lower lows generally indicate a downward structure.
This distinction becomes particularly important when markets experience sharp price movements.
A declining market may be undergoing a temporary correction within an established uptrend. Alternatively, the same downward movement could represent a continuation of an existing bearish trend.
The difference is not necessarily visible from the latest candlestick alone.
Instead, examining the sequence of significant swing highs and lows can provide a more complete picture of the underlying market environment.
Gold: A Bearish Structure With Resistance Overhead
The weekly Gold futures chart provides an example of an established bearish structure.
Following its earlier peak in 2026, Gold experienced a substantial decline. Subsequent recovery attempts failed to establish new highs, while later selling pressure produced progressively lower prices.
The resulting sequence of lower highs and lower lows illustrates how bearish market structure develops.
Based on the November 1 chart, Gold futures were trading around $3,898.9 per troy ounce.
Two significant price areas deserve attention:
- Weekly UFO resistance: $4,091.2–$4,242.3.
- Weekly UFO support: $3,660.5–$3,744.0.
The resistance area represents a region where renewed selling pressure could become relevant if prices recover.
The support area identifies a lower region where the market's response may provide additional information about the persistence of the bearish structure.
Importantly, neither area guarantees a reversal.
For example, an upward reaction from support could initially represent a countertrend recovery rather than the beginning of a sustained bullish reversal.
Likewise, an upward breakout through resistance would not automatically establish a new bullish trend. Further evidence, including changes in the sequence of significant highs and lows, would be needed.
S&P 500: A Correction Within a Broader Bullish Structure
The weekly E-mini S&P 500 futures chart presents a different situation.
Despite the recent decline, the broader chart continues to exhibit a recognizable sequence of higher highs and higher lows.
This suggests that the current downward movement may still be interpreted as a correction within a larger upward structure, unless subsequent price action provides evidence of structural deterioration.
Based on the November 1 chart, ES futures were trading around 7,614.
The principal UFO weekly support area is located between 7,324.00 and 7,563.50.
Interestingly, the latest weekly low reached 7,558.25, marginally entering the upper boundary of this support area before the displayed price recovered above it.
This illustrates another important distinction: entering a support zone is not necessarily equivalent to breaking it.
A temporary penetration may be followed by a recovery, while sustained trading below the zone could indicate a more significant change in market conditions.
The response to the entire support area, rather than a single price level, is therefore central to evaluating the broader structure.
Three Possible Reactions at Support and Resistance
Support and resistance should be treated as areas where traders evaluate market behavior rather than locations that automatically generate trading signals.
Three general scenarios are particularly relevant when volatility increases.
- Rejection: Price reaches a significant support or resistance area but fails to sustain movement through it. Subsequent price action may provide evidence that the existing area remains relevant.
- Confirmed breakout: Price moves beyond a significant area and demonstrates sustained acceptance outside its boundaries. Depending on the broader structure, this may indicate continuation or a developing structural change.
- False breakout: Price temporarily moves through support or resistance but subsequently returns inside the previous range. Such movements illustrate the limitations of interpreting an initial breakout as definitive confirmation.
These scenarios are not mutually exclusive over time. A market may initially reject a zone, subsequently break through it, and later retest the same area from the opposite direction.
Consequently, the quality of confirmation, the broader market structure, and the distance to the next relevant price area all matter.
Illustrative Scenario 1: A Resistance Rejection in Gold
Consider a hypothetical situation in which Gold recovers toward its weekly resistance area between $4,091.2 and $4,242.3.
Rather than assuming that reaching resistance will produce a reversal, the analytical process would involve observing whether price action demonstrates renewed selling pressure.
For illustration, suppose a rejection develops and the following parameters are considered:
- Hypothetical short entry: $4,100.
- Stop/invalidation level: $4,250.
- Potential target: $3,750.
- Distance to stop: $150 per troy ounce.
- Distance to target: $350 per troy ounce.
- Illustrative reward-to-risk ratio: approximately 2.33:1.
The target is positioned slightly above the identified weekly support area, acknowledging that an opposing support zone could interrupt a downward movement.
A sustained breakout above $4,242.3 would weaken the original resistance-rejection interpretation. The hypothetical stop at $4,250 provides a predefined exit level, although execution at that exact price cannot be guaranteed.
The scenario illustrates how an existing bearish structure, a significant resistance area, and an opposing support level can be combined into a conditional risk-management framework.
It does not imply that Gold will reach the proposed entry or target.
Illustrative Scenario 2: A Support Reaction in the S&P 500
Now consider the S&P 500.
Unlike Gold, its broader weekly structure remains bullish.
Suppose ES revisits the upper portion of the weekly support area and subsequently demonstrates evidence of renewed buying pressure.
A hypothetical scenario might use:
- Hypothetical long entry following confirmation: 7,565.
- Stop/invalidation level: 7,315.
- Potential target: 7,820.
- Distance to stop: 250 index points.
- Distance to target: 255 index points.
- Illustrative reward-to-risk ratio: approximately 1.02:1.
The stop is positioned beneath the weekly support area, while the hypothetical target is near the recent upper price region.
Although the broader structure supports considering a bullish continuation scenario, the relatively modest reward-to-risk relationship raises an important question.
Is the potential distance to the target sufficient relative to the distance required for structural invalidation?
This illustrates why identifying support does not automatically establish an attractive hypothetical setup.
A confirmed breakdown beneath 7,324 would challenge the bullish interpretation associated with that support area. A subsequent failed retest from below could instead support an alternative bearish continuation scenario.
Contract Size, Margin, and Risk
Futures contract specifications are essential when translating hypothetical price movements into dollar exposure.
Standard Gold futures (GC) represent 100 troy ounces, while Micro Gold futures (MGC) represent 10 troy ounces.
Consequently, a $1 movement in the quoted Gold price corresponds to $100 per GC contract or $10 per MGC contract.
For the illustrative Gold scenario, the $150 distance between entry and stop therefore represents:
- GC: $15,000 of theoretical price risk per contract.
- MGC: $1,500 of theoretical price risk per contract.
Similarly, E-mini S&P 500 futures (ES) have a multiplier of $50 per index point, compared with $5 for Micro E-mini S&P 500 futures (MES).
The illustrative 250-point stop distance in the ES scenario represents:
- ES: $12,500 of theoretical price risk per contract.
- MES: $1,250 of theoretical price risk per contract.
These calculations exclude transaction costs, slippage, and potential gaps. Actual losses may exceed the amounts calculated from the hypothetical stop distances.
Margin requirements must also be distinguished from trade risk.
Currently, margin estimates are set as ~$20,200 for GC, $2,020 for MGC, $25,960 for ES, and $2,596 for MES.
These are approximate margin estimates. Exchange performance-bond requirements can change with market conditions, and applicable initial margin, maintenance margin, and broker requirements should be checked independently.
A margin deposit is not the maximum amount that can be lost on a futures position.
Managing Uncertainty Around Major Events
The possibility of increased volatility introduces additional considerations.
Prices can move rapidly through previously established levels. A breakout may reverse before confirmation develops, while a stop order may execute at a different price from the intended level.
Traders evaluating such conditions may therefore consider whether to wait for additional confirmation, reduce hypothetical position size, or avoid situations where the required stop distance exceeds their predefined risk limits.
The important principle is that market structure provides context, but risk management determines whether a particular scenario is compatible with the trader's constraints.
Conclusion: Read the Structure, Not Just the Headlines
The approaching US midterm elections provide a timely backdrop for comparing Gold and the S&P 500, but the educational lesson extends far beyond any single event.
Both markets have recently moved lower.
Gold exhibits a bearish weekly structure, with resistance overhead and support beneath current prices.
The S&P 500, meanwhile, retains a broader bullish structure while correcting toward an established support area.
These differences illustrate why price direction alone is insufficient to characterize market conditions.
Whether a significant zone produces a rejection, a confirmed breakout, or a false breakout, the analytical process remains the same: evaluate the broader structure, identify relevant price areas, consider alternative outcomes, and define the associated risk.
The objective is not to predict how markets will react to a particular headline.
It is to develop a consistent framework for interpreting their behavior.
Data Consideration
When charting futures, the data provided could be delayed. Traders working with the ticker symbols discussed in this idea may prefer to use CME Group real-time data plan on TradingView: tradingview.com/cme - This consideration is particularly important for shorter-term traders, whereas it may be less critical for those focused on longer-term trading strategies.
General Disclaimer
The trade ideas presented herein are solely for illustrative purposes forming a part of a case study intended to demonstrate key principles in risk management within the context of the specific market scenarios discussed. These ideas are not to be interpreted as investment recommendations or financial advice. They do not endorse or promote any specific trading strategies, financial products, or services. The information provided is based on data believed to be reliable; however, its accuracy or completeness cannot be guaranteed. Trading in financial markets involves risks, including the potential loss of principal. Each individual should conduct their own research and consult with professional financial advisors before making any investment decisions. The author or publisher of this content bears no responsibility for any actions taken based on the information provided or for any resultant financial or other losses.

Trade Smarter — See What Most Traders Don’t. Explore AutoClimate™ and AutoUFOs® (patented) in the UFO Trading Suite: tradingview.com/spaces/traddictiv/
関連の投稿
免責事項
これらの情報および投稿は、TradingViewが提供または承認する金融、投資、取引、またはその他の種類の助言もしくは推奨であることを意図したものではなく、またこれらに該当するものでもありません。詳細は利用規約をご覧ください。
Trade Smarter — See What Most Traders Don’t. Explore AutoClimate™ and AutoUFOs® (patented) in the UFO Trading Suite: tradingview.com/spaces/traddictiv/
関連の投稿
免責事項
これらの情報および投稿は、TradingViewが提供または承認する金融、投資、取引、またはその他の種類の助言もしくは推奨であることを意図したものではなく、またこれらに該当するものでもありません。詳細は利用規約をご覧ください。