
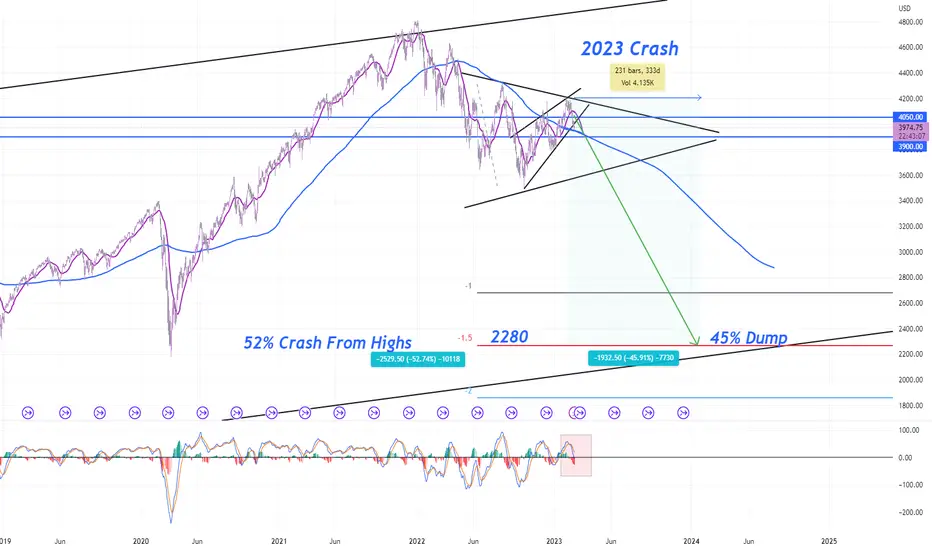
I will reference the 1973 crash as proof that this is what is happening today.
Similarities:
8% between the 200sma and the all time High
Daily Pennant/ Triangle Formation
Bear Market Rally breaking above the 200sma, formed a double top
45% crash in prices in 232 trading days
50% crash from all time highs
1973 went 3 full range expansions
2023 potentially go to 1.5 full range expansions
Both years ending in 3
MACD above the zero line, bearish cross and rolled over
I will ride it down to 2280 and then accumulate SPY at 230
Massive wealth will be available to those who take it
Here is the chart of November 1973 and how they are IDENTICAL to today

関連の投稿
免責事項
これらの情報および投稿は、TradingViewが提供または承認する金融、投資、取引、またはその他の種類の助言もしくは推奨であることを意図したものではなく、またこれらに該当するものでもありません。詳細は利用規約をご覧ください。
関連の投稿
免責事項
これらの情報および投稿は、TradingViewが提供または承認する金融、投資、取引、またはその他の種類の助言もしくは推奨であることを意図したものではなく、またこれらに該当するものでもありません。詳細は利用規約をご覧ください。