
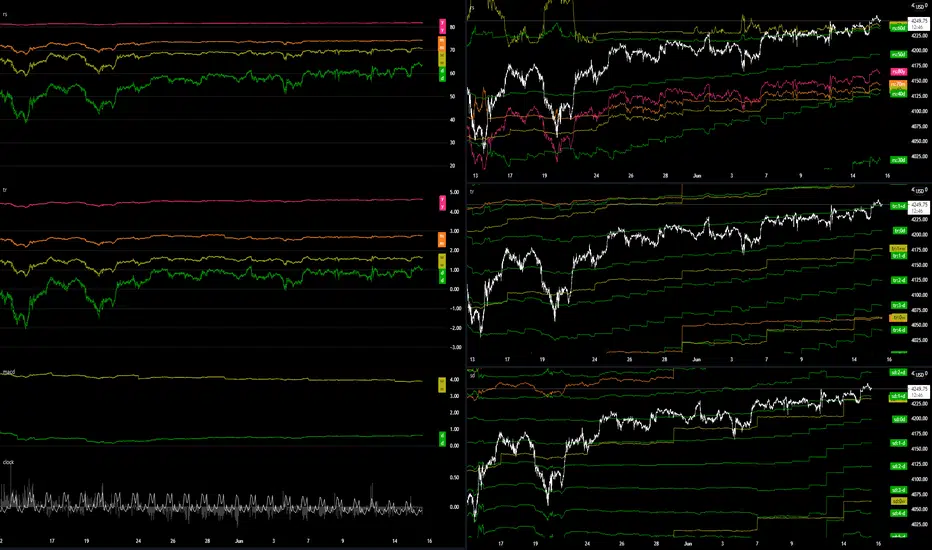
Multi-Timeframe view of the single timeframe idea posted, showing you the full view of how the indicator plots of different timeframes combine to move price.
Here the daily tr +1 and weekly rsi weekly levels have stopped the S&P500 from climbing higher for weeks.
Here the daily tr +1 and weekly rsi weekly levels have stopped the S&P500 from climbing higher for weeks.

免責事項
これらの情報および投稿は、TradingViewが提供または承認する金融、投資、取引、またはその他の種類の助言もしくは推奨であることを意図したものではなく、またこれらに該当するものでもありません。詳細は利用規約をご覧ください。
免責事項
これらの情報および投稿は、TradingViewが提供または承認する金融、投資、取引、またはその他の種類の助言もしくは推奨であることを意図したものではなく、またこれらに該当するものでもありません。詳細は利用規約をご覧ください。