
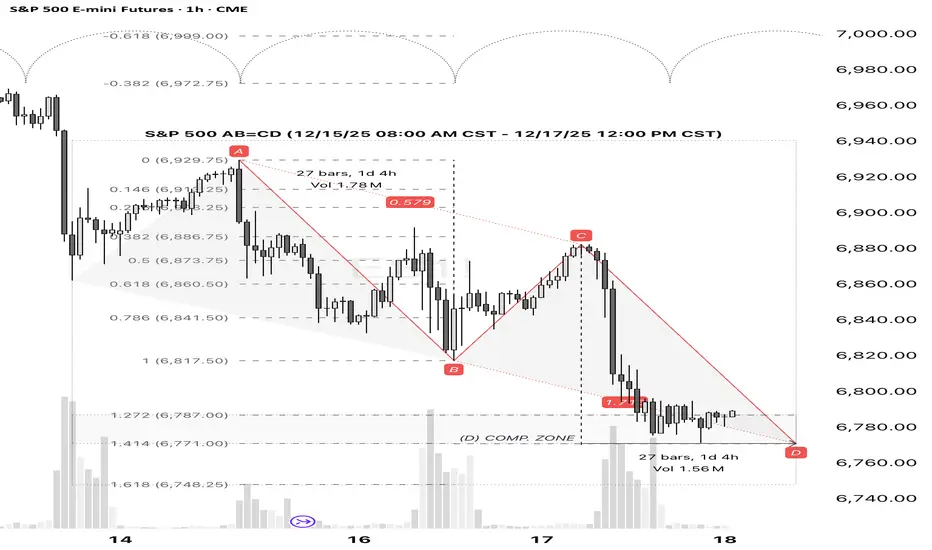
S&P 500 (SPX) - Technical Analysis: Bullish Reversal Signal at AB=CD Completion
1. Pattern Recognition:
A classic bullish AB=CD harmonic pattern has reached its precise completion point (D). This validates the designated support zone as a significant technical area where buyer momentum is anticipated to overcome recent selling pressure.
2. Market Structure Implications:
The successful completion of this pattern suggests:
· The establishment of a firm, technically-defined support level.
· Exhaustion of the prior downward (CD) leg.
· An increased probability of a mean-reversion move higher, targeting a retracement of the recent decline.
3. Trade Thesis & Risk Management:
The confluence at the D point presents a favorable risk/reward opportunity for a long position.
· Action: Initiate long positions.
· Entry Zone: At or near the pattern's D completion point.
· Invalidation Level: A decisive close below the D point invalidates the pattern structure. Place stop loss accordingly.
· Primary Target: The 0.618 Fibonacci retracement of the CD leg.
· Secondary Target: The initiation point (C) of the pattern.
1. Pattern Recognition:
A classic bullish AB=CD harmonic pattern has reached its precise completion point (D). This validates the designated support zone as a significant technical area where buyer momentum is anticipated to overcome recent selling pressure.
2. Market Structure Implications:
The successful completion of this pattern suggests:
· The establishment of a firm, technically-defined support level.
· Exhaustion of the prior downward (CD) leg.
· An increased probability of a mean-reversion move higher, targeting a retracement of the recent decline.
3. Trade Thesis & Risk Management:
The confluence at the D point presents a favorable risk/reward opportunity for a long position.
· Action: Initiate long positions.
· Entry Zone: At or near the pattern's D completion point.
· Invalidation Level: A decisive close below the D point invalidates the pattern structure. Place stop loss accordingly.
· Primary Target: The 0.618 Fibonacci retracement of the CD leg.
· Secondary Target: The initiation point (C) of the pattern.
トレード終了: 利益確定目標に到達
Price successfully reached the key dual-target confluence of the 0.618 Fib level and the pattern's 'C' point. Trade closed.
🌊 Markets move in geometry before they move in headlines.
免責事項
これらの情報および投稿は、TradingViewが提供または承認する金融、投資、取引、またはその他の種類の助言もしくは推奨であることを意図したものではなく、またこれらに該当するものでもありません。詳細は利用規約をご覧ください。
🌊 Markets move in geometry before they move in headlines.
免責事項
これらの情報および投稿は、TradingViewが提供または承認する金融、投資、取引、またはその他の種類の助言もしくは推奨であることを意図したものではなく、またこれらに該当するものでもありません。詳細は利用規約をご覧ください。