
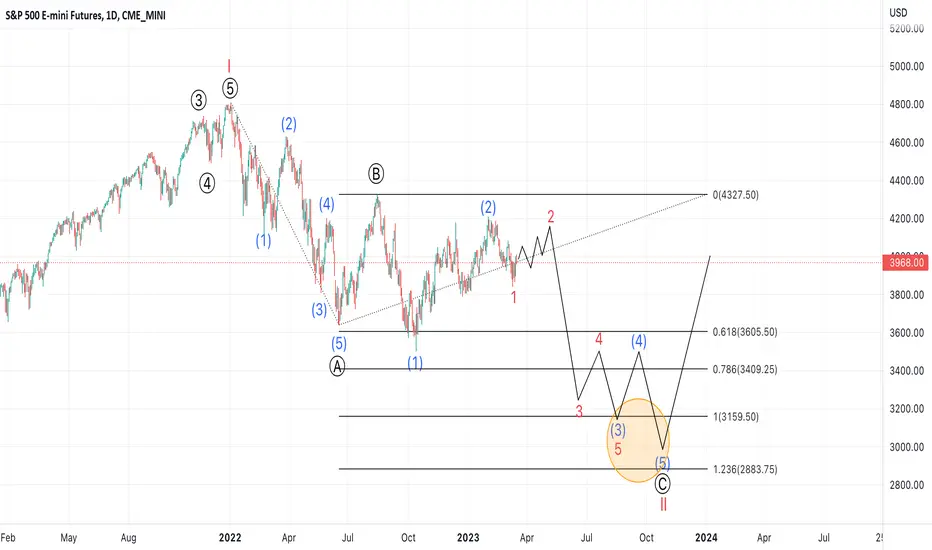
Short and Medium term structure S&P is bearish once it makes a new low around 3,500. Now we expects more downside to 3,100 as it's shown in the orange circle in Daily Chart. We expects a reverse in this circle area and we saw a strong correlation with other indices (American, European and Asian). Next week, we'll update this forecast.

✅ Get trading news and learn about amazing trading strategies, tools and education
✅ iOS App: itunes.apple.com/app/id6471829868
✅ Android App: play.google.com/store/apps/details?id=com.marketrightside.marketrightside
✅ iOS App: itunes.apple.com/app/id6471829868
✅ Android App: play.google.com/store/apps/details?id=com.marketrightside.marketrightside
免責事項
これらの情報および投稿は、TradingViewが提供または承認する金融、投資、取引、またはその他の種類の助言もしくは推奨であることを意図したものではなく、またこれらに該当するものでもありません。詳細は利用規約をご覧ください。
✅ Get trading news and learn about amazing trading strategies, tools and education
✅ iOS App: itunes.apple.com/app/id6471829868
✅ Android App: play.google.com/store/apps/details?id=com.marketrightside.marketrightside
✅ iOS App: itunes.apple.com/app/id6471829868
✅ Android App: play.google.com/store/apps/details?id=com.marketrightside.marketrightside
免責事項
これらの情報および投稿は、TradingViewが提供または承認する金融、投資、取引、またはその他の種類の助言もしくは推奨であることを意図したものではなく、またこれらに該当するものでもありません。詳細は利用規約をご覧ください。