
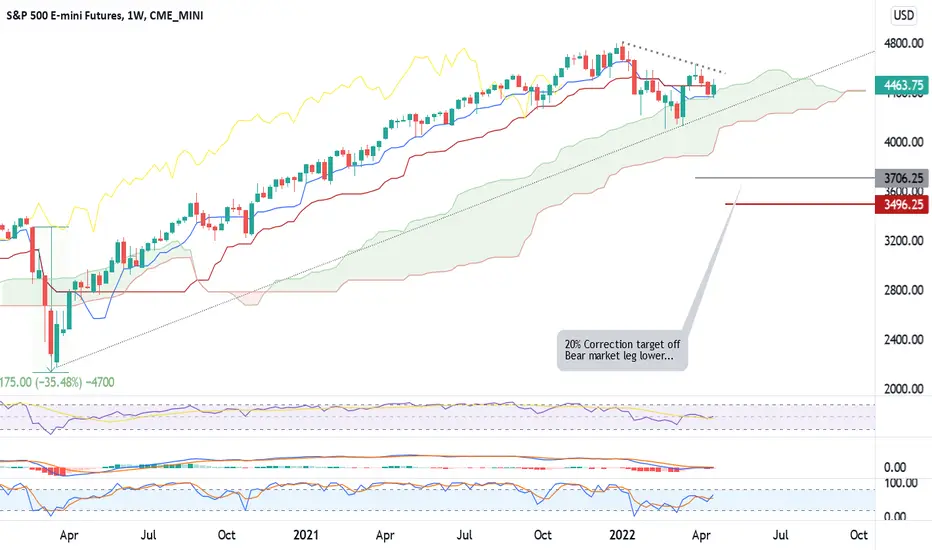
E-mini S&P 500 (futures) – Weekly: Momentum Indicators (Stochastic, MACD, RSI) Trying to maintain upward momentum, but mostly neutral.
Ichimoku (at a glance) Indicator(s) Blue Tenkan line and Cloud support at 4366 held last week and so far this week. Yellow Lagging (26wk) indicator is attracted to previous price action and has been retracing previous prices the past 7 weeks. The bounce off the cloud is trying to rally bulls above the red Kijun resistance at 4455 and then to the downtrend line in the 4600 area. A break below into the cloud has support at 4100.
Support seems strong but a move below 4100 opens the door for a change in trend lower. 1. Tenkan crosses below Kijun 2. Lagging indicator below previous price action. 3. A break below the cloud 4. Cloud twist from green to red
Ichimoku (at a glance) Indicator(s) Blue Tenkan line and Cloud support at 4366 held last week and so far this week. Yellow Lagging (26wk) indicator is attracted to previous price action and has been retracing previous prices the past 7 weeks. The bounce off the cloud is trying to rally bulls above the red Kijun resistance at 4455 and then to the downtrend line in the 4600 area. A break below into the cloud has support at 4100.
Support seems strong but a move below 4100 opens the door for a change in trend lower. 1. Tenkan crosses below Kijun 2. Lagging indicator below previous price action. 3. A break below the cloud 4. Cloud twist from green to red

関連の投稿
免責事項
これらの情報および投稿は、TradingViewが提供または承認する金融、投資、取引、またはその他の種類の助言もしくは推奨であることを意図したものではなく、またこれらに該当するものでもありません。詳細は利用規約をご覧ください。
免責事項
これらの情報および投稿は、TradingViewが提供または承認する金融、投資、取引、またはその他の種類の助言もしくは推奨であることを意図したものではなく、またこれらに該当するものでもありません。詳細は利用規約をご覧ください。