
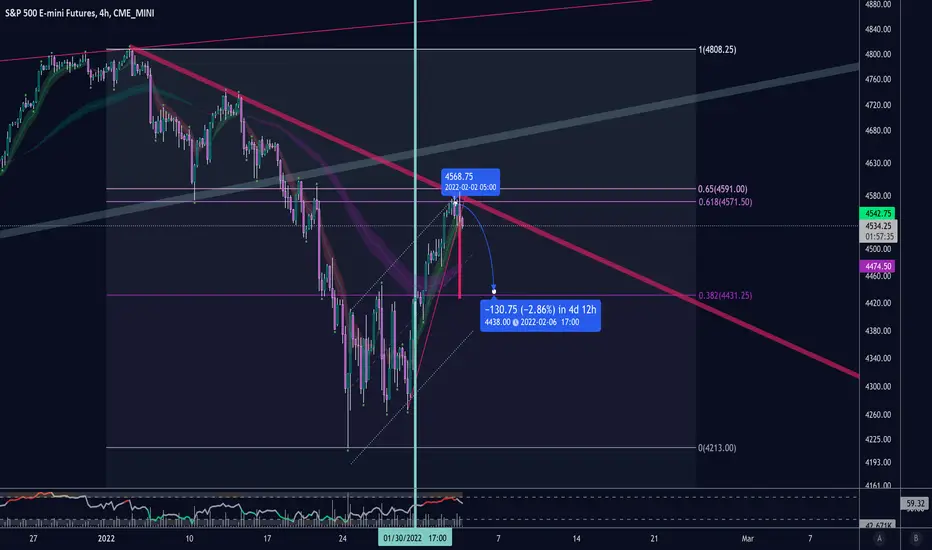
Tom Demark famously described TD supply and demand lines. In doing so, he also described tendency for price action to involve symmetry upon the upward or downward break of a trendline.
In this case, price has broke downward from the most recent TD demand line. Demark provides a step-wise approach to project price based on trend break. In essence, take the absolute highest (lowest) top from the trendline and resolve that distance at the exact point of trend break.
Extrapolating this method, we see that the projected price is approximately 4430-40 which also is the backtest of the recent breakout.
On higher time frames, the exact bottom of this recent trend could be predicted by extrapolating the distance from the TD demand line on November 5, 2021 to the breakdown on January 18, 2022 which gives approximately 350 points down, which is where price settled and reversed.
In this case, price has broke downward from the most recent TD demand line. Demark provides a step-wise approach to project price based on trend break. In essence, take the absolute highest (lowest) top from the trendline and resolve that distance at the exact point of trend break.
Extrapolating this method, we see that the projected price is approximately 4430-40 which also is the backtest of the recent breakout.
On higher time frames, the exact bottom of this recent trend could be predicted by extrapolating the distance from the TD demand line on November 5, 2021 to the breakdown on January 18, 2022 which gives approximately 350 points down, which is where price settled and reversed.

免責事項
これらの情報および投稿は、TradingViewが提供または承認する金融、投資、取引、またはその他の種類の助言もしくは推奨であることを意図したものではなく、またこれらに該当するものでもありません。詳細は利用規約をご覧ください。
免責事項
これらの情報および投稿は、TradingViewが提供または承認する金融、投資、取引、またはその他の種類の助言もしくは推奨であることを意図したものではなく、またこれらに該当するものでもありません。詳細は利用規約をご覧ください。