
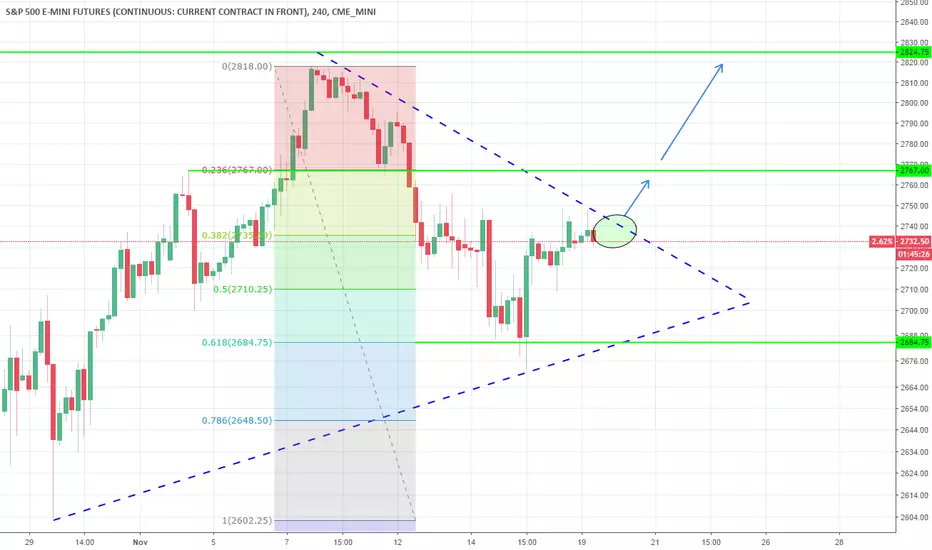
The index has developed a Triangle on 1D (RSI = 45.946, CCI = -19.2621, Highs/Lows = 0.0000) following last week's decline near 2,670. On the positive side the 0.618 Fibonacci level (2,684.75) was only broken that one time on 1D and has since held support. If that level stays intact then the Triangle has more chances to break higher with 2,767 as the first Resistance before the critical 2,824.75 test. We are still bullish on medium term with TP = 2,893.
** If you like our free content follow our profile (tradingview.com/u/InvestingScope) to get more daily ideas. **
Comments and likes are greatly appreciated.
** If you like our free content follow our profile (tradingview.com/u/InvestingScope) to get more daily ideas. **
Comments and likes are greatly appreciated.

I trade Crypto, Forex, Indices & Commodities all from one account on PrimeXBT with TradingView charts
Register here👉 investingscope.s.gy/PrimeXBT
Contact me for Account Management (+15% monthly profit)
Telegram👉 t.me/investingscope
Register here👉 investingscope.s.gy/PrimeXBT
Contact me for Account Management (+15% monthly profit)
Telegram👉 t.me/investingscope
免責事項
これらの情報および投稿は、TradingViewが提供または承認する金融、投資、取引、またはその他の種類の助言もしくは推奨であることを意図したものではなく、またこれらに該当するものでもありません。詳細は利用規約をご覧ください。
I trade Crypto, Forex, Indices & Commodities all from one account on PrimeXBT with TradingView charts
Register here👉 investingscope.s.gy/PrimeXBT
Contact me for Account Management (+15% monthly profit)
Telegram👉 t.me/investingscope
Register here👉 investingscope.s.gy/PrimeXBT
Contact me for Account Management (+15% monthly profit)
Telegram👉 t.me/investingscope
免責事項
これらの情報および投稿は、TradingViewが提供または承認する金融、投資、取引、またはその他の種類の助言もしくは推奨であることを意図したものではなく、またこれらに該当するものでもありません。詳細は利用規約をご覧ください。