
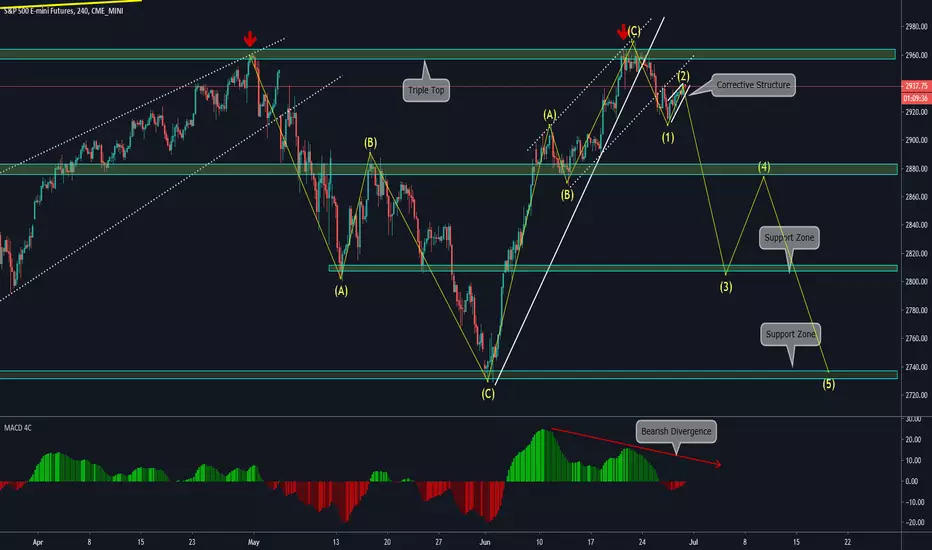
Main Items we can see on the 4HS chart:
a)Using Elliott Wave Theory we can conclude that if we had ABC ( Bearish Movement) / ABC (Current Bullish Movement). Now we can expect a 12345 bearish movement following the idea of a Flat Correction
b)On every timeframe starting on the Weekly Chart we can see Divergences on MACD, (this kind of Signal is possibly showing the weakness of the bullish movement)
c)We have a Triple Top pattern, which is a major reversal zone that was tested on 2 Historical Maximums, and in this last bullish movement, the price was also rejected from there.
d)Currently, we have a Corrective Structure in which the breakout will give us valuable information about the direction the price may take
MULTI TIMEFRAME VISION:
-Weekly:

-Daily:

a)Using Elliott Wave Theory we can conclude that if we had ABC ( Bearish Movement) / ABC (Current Bullish Movement). Now we can expect a 12345 bearish movement following the idea of a Flat Correction
b)On every timeframe starting on the Weekly Chart we can see Divergences on MACD, (this kind of Signal is possibly showing the weakness of the bullish movement)
c)We have a Triple Top pattern, which is a major reversal zone that was tested on 2 Historical Maximums, and in this last bullish movement, the price was also rejected from there.
d)Currently, we have a Corrective Structure in which the breakout will give us valuable information about the direction the price may take
MULTI TIMEFRAME VISION:
-Weekly:
-Daily:

免責事項
これらの情報および投稿は、TradingViewが提供または承認する金融、投資、取引、またはその他の種類の助言もしくは推奨であることを意図したものではなく、またこれらに該当するものでもありません。詳細は利用規約をご覧ください。
免責事項
これらの情報および投稿は、TradingViewが提供または承認する金融、投資、取引、またはその他の種類の助言もしくは推奨であることを意図したものではなく、またこれらに該当するものでもありません。詳細は利用規約をご覧ください。