
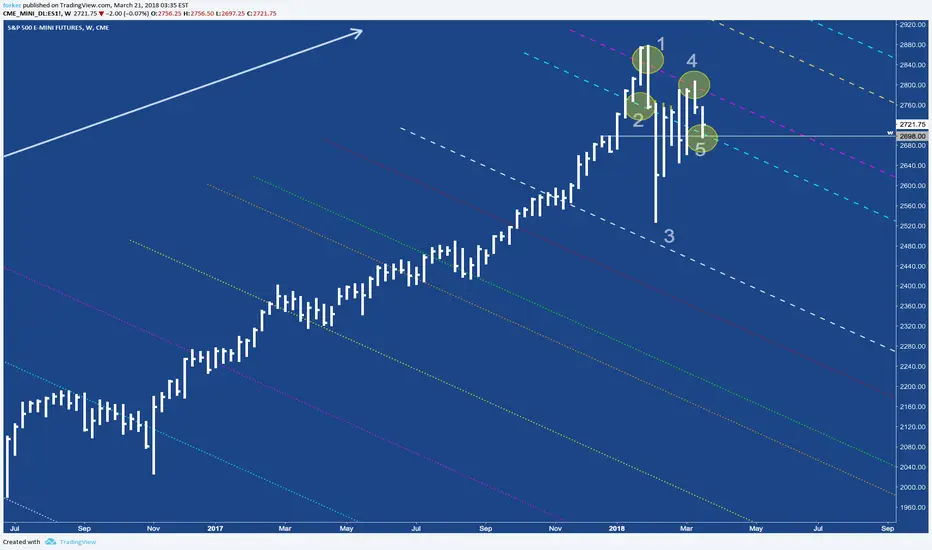
Many weeks ago, I freshly published this chart. I wanted to make a longterm project out of it.
The idea behind this chart is, to show you LIVE how pure Action/Reaction works - and that it's not a mystery, fake or something "balloonie".
Here you have 5! reactions in a relative short period of time. Let's go through them right now:
1 Overshoot and fall back to...
2 ...last magenta A/R line, which provided support.
3 Price drops from prior support down to the next line, but creating, what we at ForkTrading call a confirmed "Hagopian" (you learn about this in my free ForkTrading BLUEPRINT).
4 From 3 price moves up and reacts even three times at the magenta A/R line, bouncing it's head on it, before moving up to the magenta A/R line, just to find resistance and...
5. drops back to the magenta A/R line again where it finds support.
What do you say now?
On my website you find a free subscription to start learning the Basics of ForkTrading, which stems directly from Action/Reaction, but offers much more room for trading then just plain Action/Reaction.
I appreciate you thumb up and would love to have you on board in our ForkTrading Group soon.
P!
ノート
Sooooo...here we are.What do you think where price will hit next? ;-)
ノート
Here we have a follow up on the A/R model.Note how price bumped it's head...next stop will be the white A/R line.

Remove subjective trading:
👉 Andrews Pitchforks applied by fixed rules
👉 Weekly structure maps for Indices, Futures, Energy and Crypto, plus the method behind them.
→ alphametrics.substack.com/?utm_source=tradingview
👉 Andrews Pitchforks applied by fixed rules
👉 Weekly structure maps for Indices, Futures, Energy and Crypto, plus the method behind them.
→ alphametrics.substack.com/?utm_source=tradingview
免責事項
これらの情報および投稿は、TradingViewが提供または承認する金融、投資、取引、またはその他の種類の助言もしくは推奨であることを意図したものではなく、またこれらに該当するものでもありません。詳細は利用規約をご覧ください。