
etc story is bit intresting
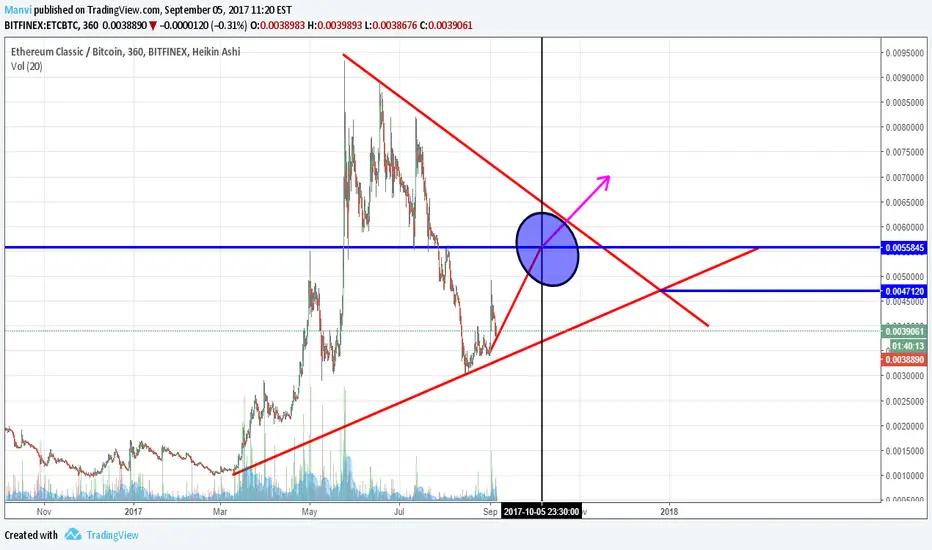
so lets try to undersatnd wht is happenning out here so take a look at chart
etc price in jan,17 = 0.00125-0.00150
etc went in may,17 = 0.00675-0.00912
then again a dip in july,17 = 0.00315-0.00335
now again will go up in 5th oct,17 = 0.00565-0.00595
then etc can pump a big upto 0.012 otherwise next dump will bring etc down to 0.00491 level like (july,17)
and then again same pattern
so lets try to undersatnd wht is happenning out here so take a look at chart
etc price in jan,17 = 0.00125-0.00150
etc went in may,17 = 0.00675-0.00912
then again a dip in july,17 = 0.00315-0.00335
now again will go up in 5th oct,17 = 0.00565-0.00595
then etc can pump a big upto 0.012 otherwise next dump will bring etc down to 0.00491 level like (july,17)
and then again same pattern

免責事項
これらの情報および投稿は、TradingViewが提供または承認する金融、投資、取引、またはその他の種類の助言もしくは推奨であることを意図したものではなく、またこれらに該当するものでもありません。詳細は利用規約をご覧ください。
免責事項
これらの情報および投稿は、TradingViewが提供または承認する金融、投資、取引、またはその他の種類の助言もしくは推奨であることを意図したものではなく、またこれらに該当するものでもありません。詳細は利用規約をご覧ください。