
Traders,
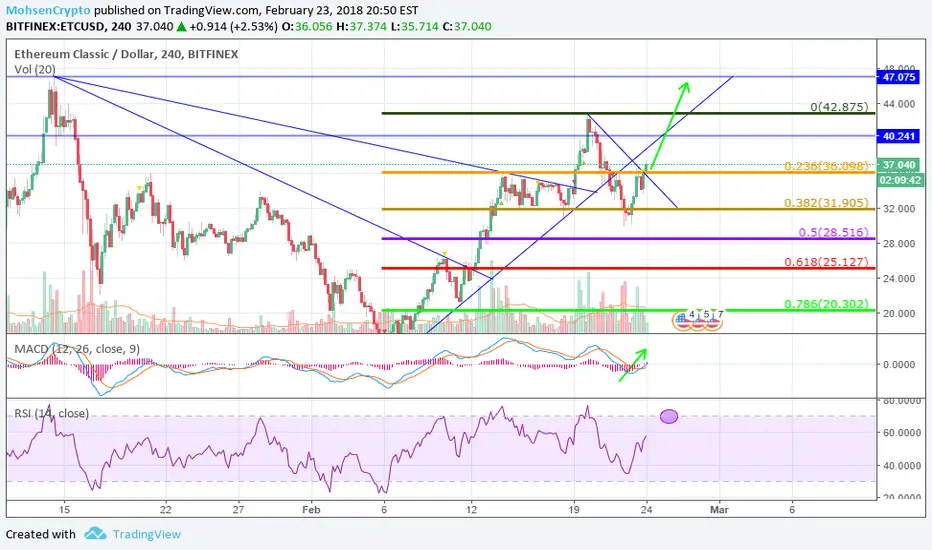
Here w have ETC/USD 4H chart.
After breaking-down the bull trend-line a few hours ago and not breaking the 0.0.382 Fibonacci. we are heading to 0 Fib the inverse and I'm gonna draw the not inverse next few hours to reach the all time high again
After closing above that one we will
will be confirmed break & heading straight to all time high again.
Without closing we will retest the uptrend again and waiting of bull keep going
Regards,
Mohsen
Here w have ETC/USD 4H chart.
After breaking-down the bull trend-line a few hours ago and not breaking the 0.0.382 Fibonacci. we are heading to 0 Fib the inverse and I'm gonna draw the not inverse next few hours to reach the all time high again
After closing above that one we will
will be confirmed break & heading straight to all time high again.
Without closing we will retest the uptrend again and waiting of bull keep going
Regards,
Mohsen

Market analysis, scalping calls, Binance Alts signals and real time news & Sentiment on:
Telegram: t.me/MO_Trading
Twitter: twitter.com/MoTradr
Telegram: t.me/MO_Trading
Twitter: twitter.com/MoTradr
関連の投稿
免責事項
これらの情報および投稿は、TradingViewが提供または承認する金融、投資、取引、またはその他の種類の助言もしくは推奨であることを意図したものではなく、またこれらに該当するものでもありません。詳細は利用規約をご覧ください。
Market analysis, scalping calls, Binance Alts signals and real time news & Sentiment on:
Telegram: t.me/MO_Trading
Twitter: twitter.com/MoTradr
Telegram: t.me/MO_Trading
Twitter: twitter.com/MoTradr
関連の投稿
免責事項
これらの情報および投稿は、TradingViewが提供または承認する金融、投資、取引、またはその他の種類の助言もしくは推奨であることを意図したものではなく、またこれらに該当するものでもありません。詳細は利用規約をご覧ください。