
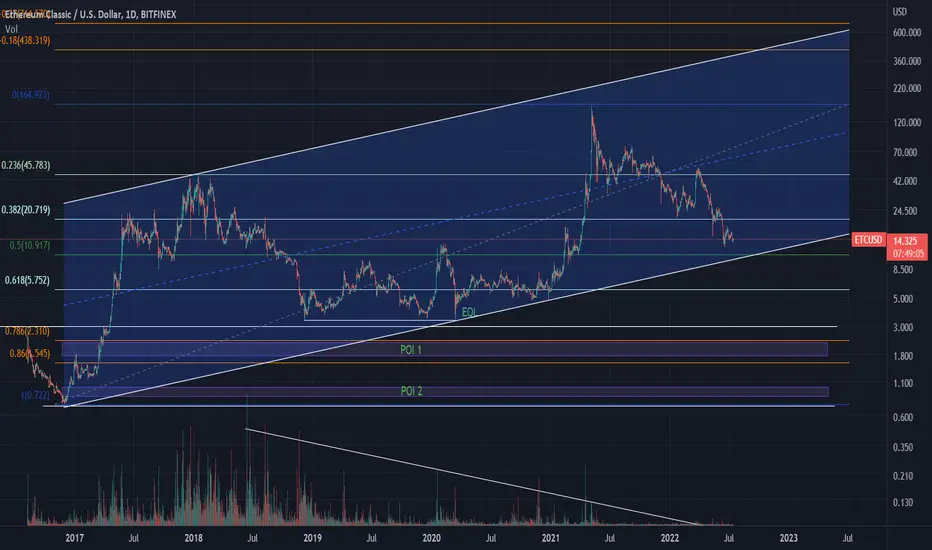
As we can see on the ETC chart, even levels formed without removing liquidity. Major stops and liquidity are below previous lows. Locally, upward movement is possible, but globally, we have an untraded part of the chart, where small holders capitulate, and big capital can gain their positions. Since before that the price had risen to $140 with no volume, I think that the growth was manipulative and we easily can see POI 1 and POI 2 IN THE CASE IF THE PRICE EXITS OUT OF THE UP CHANNEL.

免責事項
これらの情報および投稿は、TradingViewが提供または承認する金融、投資、取引、またはその他の種類の助言もしくは推奨であることを意図したものではなく、またこれらに該当するものでもありません。詳細は利用規約をご覧ください。
免責事項
これらの情報および投稿は、TradingViewが提供または承認する金融、投資、取引、またはその他の種類の助言もしくは推奨であることを意図したものではなく、またこれらに該当するものでもありません。詳細は利用規約をご覧ください。