
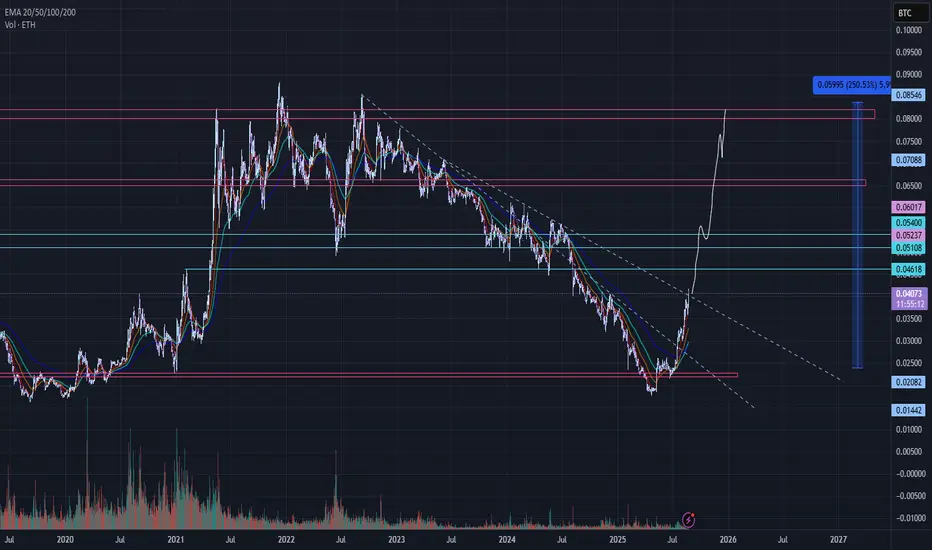
ETH pressing into ATH zone for the first time in 5 years
ETHBTC chart shows the possibility of a significant move against BTC by the end of the year.
Fundamental Adoption has spiked massively with ETF inflows matching BTC volumes, with eths market cap orders of magnitude smaller...
This translates to a potential and probable explosive move upwards potentially towards 10kusd zone on the USD chart.
That would look something like this on the BTC chart and seasonality suggests only 4months for this move to take place...
bullish times.

関連の投稿
免責事項
これらの情報および投稿は、TradingViewが提供または承認する金融、投資、取引、またはその他の種類の助言もしくは推奨であることを意図したものではなく、またこれらに該当するものでもありません。詳細は利用規約をご覧ください。
免責事項
これらの情報および投稿は、TradingViewが提供または承認する金融、投資、取引、またはその他の種類の助言もしくは推奨であることを意図したものではなく、またこれらに該当するものでもありません。詳細は利用規約をご覧ください。