After a long period of time, 
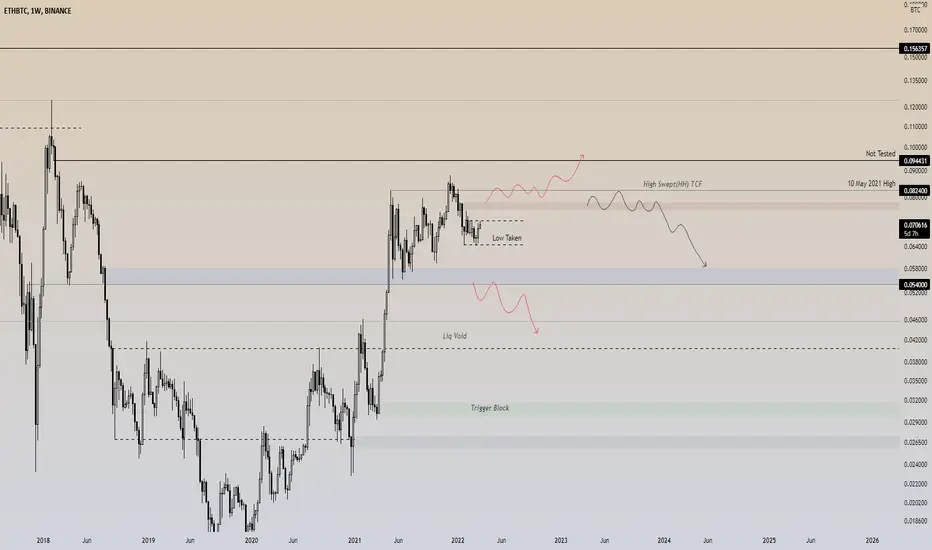
 Eth/Btc finally tested highs of May 10 2021, back in December 2021, and met with a seller pressure, which led the price to the closest demand area and now it's still in a sideways trend, which makes it unclear for Ethereum, whether if it's bullish or not. In order to talk about a bull trend. The price should close above the red box and buyers need to defend this area. Otherwise, if the area marked as "low taken" gets lost, the closest demand zone is the blue box(area).
Below the blue box, there is a huge liq. void(multiple imbalances), so losing this level will be resulted in the strong bearish environment for Ethereum against Btc.
Eth/Btc finally tested highs of May 10 2021, back in December 2021, and met with a seller pressure, which led the price to the closest demand area and now it's still in a sideways trend, which makes it unclear for Ethereum, whether if it's bullish or not. In order to talk about a bull trend. The price should close above the red box and buyers need to defend this area. Otherwise, if the area marked as "low taken" gets lost, the closest demand zone is the blue box(area). Below the blue box, there is a huge liq. void(multiple imbalances), so losing this level will be resulted in the strong bearish environment for Ethereum against Btc.

免責事項
これらの情報および投稿は、TradingViewが提供または承認する金融、投資、取引、またはその他の種類の助言もしくは推奨であることを意図したものではなく、またこれらに該当するものでもありません。詳細は利用規約をご覧ください。
免責事項
これらの情報および投稿は、TradingViewが提供または承認する金融、投資、取引、またはその他の種類の助言もしくは推奨であることを意図したものではなく、またこれらに該当するものでもありません。詳細は利用規約をご覧ください。