
Whats up traders,
Here we have ETH/BTC on the 1H chart.
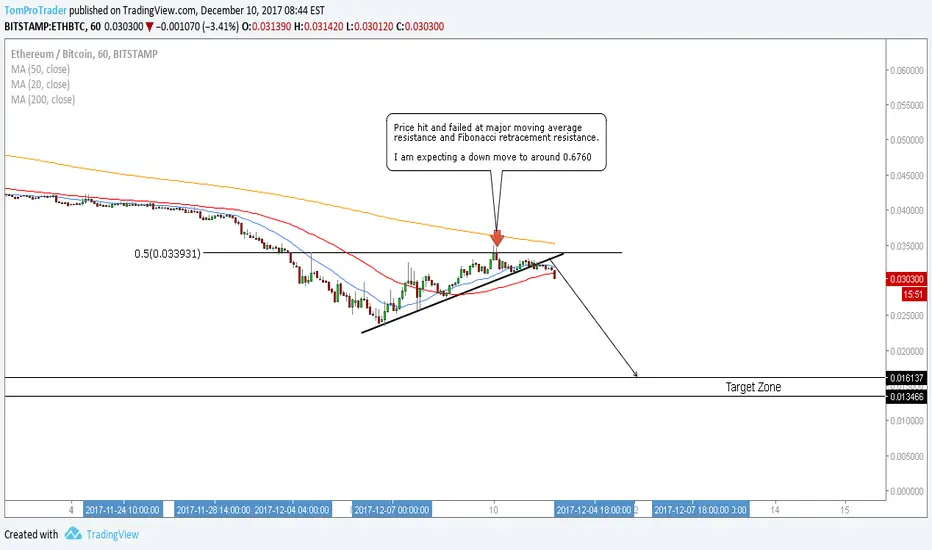
Price recently had a down impulse leg, followed by a corrective leg. The corrective leg recently stalled at 0.5 Fibonacci retracement resistance, and price has since made lower lows.
Price was correcting in a support channel structure, however the structure has recently broken and price began showing reversal candlesticks, implying a breakdown of price.
Price used 20 moving average as resistance, showing that even if the down move is intermediate (Since the 20 moving average is the smallest) it will be enough to break structure, ride the dollar dysfunction, and still deliver a profit anyway.
I am now expecting a down move in this pair to the target outlined on my chart at 0.016000.
I will update this analysis as the trade plays out.
Here we have ETH/BTC on the 1H chart.
Price recently had a down impulse leg, followed by a corrective leg. The corrective leg recently stalled at 0.5 Fibonacci retracement resistance, and price has since made lower lows.
Price was correcting in a support channel structure, however the structure has recently broken and price began showing reversal candlesticks, implying a breakdown of price.
Price used 20 moving average as resistance, showing that even if the down move is intermediate (Since the 20 moving average is the smallest) it will be enough to break structure, ride the dollar dysfunction, and still deliver a profit anyway.
I am now expecting a down move in this pair to the target outlined on my chart at 0.016000.
I will update this analysis as the trade plays out.

関連の投稿
免責事項
これらの情報および投稿は、TradingViewが提供または承認する金融、投資、取引、またはその他の種類の助言もしくは推奨であることを意図したものではなく、またこれらに該当するものでもありません。詳細は利用規約をご覧ください。
免責事項
これらの情報および投稿は、TradingViewが提供または承認する金融、投資、取引、またはその他の種類の助言もしくは推奨であることを意図したものではなく、またこれらに該当するものでもありません。詳細は利用規約をご覧ください。