ショート
Bearish Symmetric Triangle Inbound!!
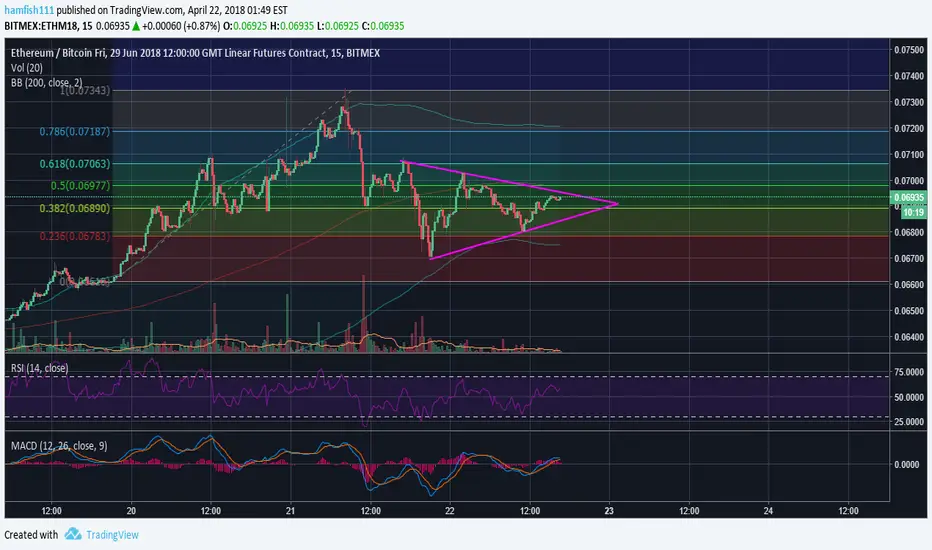
Looking at Ethereum you can see a very noticeable bearish symmetric triangle, some people may get this mixed up with a pennant but the difference between the two is that with a bearish triangle, the price starts from the high point, whereas a pennant starts from the low point.
And also looking at the MACD a crossover seems very possible to the bearish side, and the RSI looks to form a head and shoulders pattern which is also a bearish signal.
Thanks, if you liked my idea dont forget to like it and follow me for more ideas!
And also looking at the MACD a crossover seems very possible to the bearish side, and the RSI looks to form a head and shoulders pattern which is also a bearish signal.
Thanks, if you liked my idea dont forget to like it and follow me for more ideas!
ノート
i dont even understand
免責事項
これらの情報および投稿は、TradingViewが提供または承認する金融、投資、取引、またはその他の種類の助言もしくは推奨であることを意図したものではなく、またこれらに該当するものでもありません。詳細は利用規約をご覧ください。
免責事項
これらの情報および投稿は、TradingViewが提供または承認する金融、投資、取引、またはその他の種類の助言もしくは推奨であることを意図したものではなく、またこれらに該当するものでもありません。詳細は利用規約をご覧ください。