ロング
ETHO analysis with buy setup
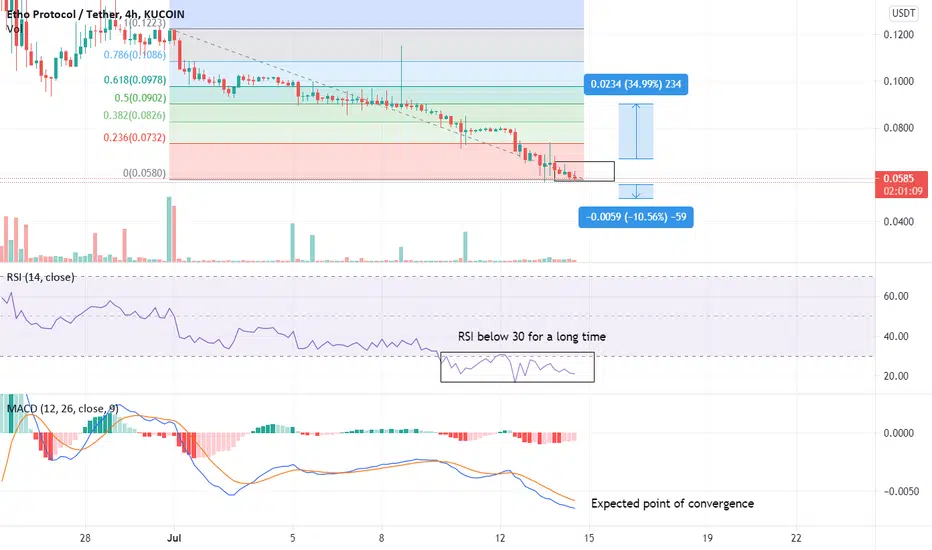
ETHO chart gives us data of future growth. This is supported by several things. Firstly, RSI below 30 point for a long while. Secondly, point of convergence for MACD. Thirdly, decreasing MACD wave. Based on that positive data we can create buy setup like this:
Buy Price: 0.0580-0.0610
TP: 0.0902
SL: 0.0500
Buy Price: 0.0580-0.0610
TP: 0.0902
SL: 0.0500

免責事項
これらの情報および投稿は、TradingViewが提供または承認する金融、投資、取引、またはその他の種類の助言もしくは推奨であることを意図したものではなく、またこれらに該当するものでもありません。詳細は利用規約をご覧ください。
免責事項
これらの情報および投稿は、TradingViewが提供または承認する金融、投資、取引、またはその他の種類の助言もしくは推奨であることを意図したものではなく、またこれらに該当するものでもありません。詳細は利用規約をご覧ください。