
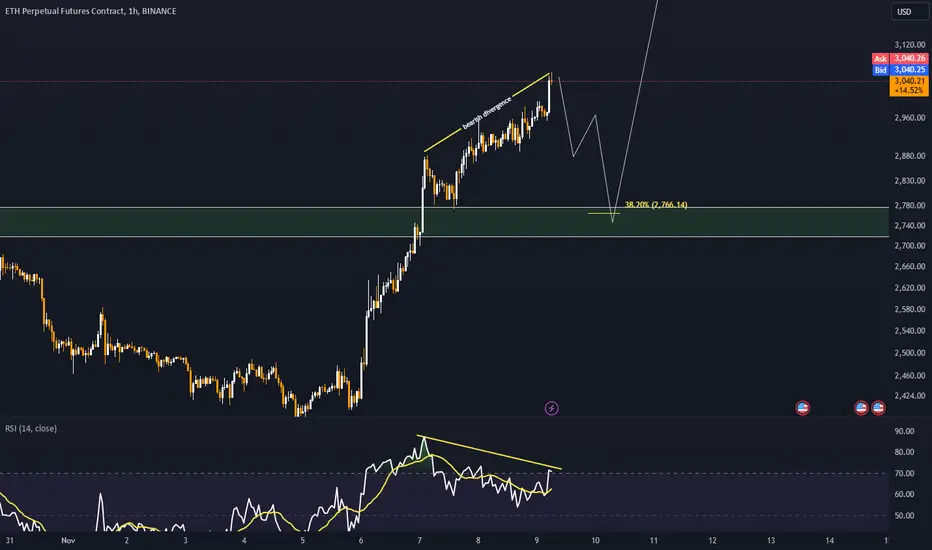
Ethereum is currently displaying signs of a bearish divergence on lower timeframes, a signal that often indicates a potential slowdown in upward momentum and the likelihood of a correction. Despite the bearish signal, the ongoing correction appears to be relatively shallow, suggesting that the underlying bullish structure remains intact.
A retracement to the 0.382 Fibonacci level could present an attractive buying opportunity for traders looking to enter at a lower risk point. This level is often viewed as a key zone for price reactions during corrections, providing a favorable balance between value and momentum for long-term positions.
A retracement to the 0.382 Fibonacci level could present an attractive buying opportunity for traders looking to enter at a lower risk point. This level is often viewed as a key zone for price reactions during corrections, providing a favorable balance between value and momentum for long-term positions.

免責事項
これらの情報および投稿は、TradingViewが提供または承認する金融、投資、取引、またはその他の種類の助言もしくは推奨であることを意図したものではなく、またこれらに該当するものでもありません。詳細は利用規約をご覧ください。
免責事項
これらの情報および投稿は、TradingViewが提供または承認する金融、投資、取引、またはその他の種類の助言もしくは推奨であることを意図したものではなく、またこれらに該当するものでもありません。詳細は利用規約をご覧ください。