ETH Rising Wedge and Breakout
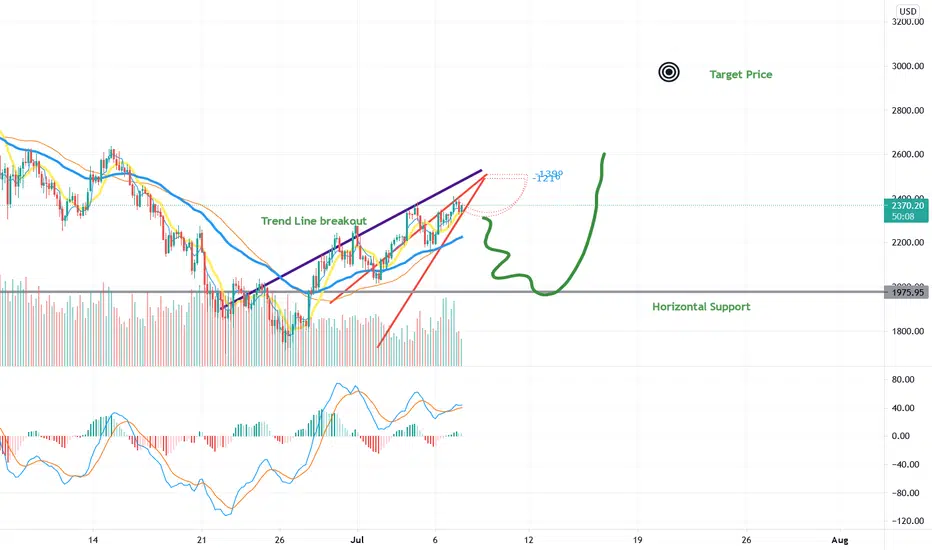
ETH is currently moving up a Rising Wedge pattern on the charts It has tested the daily resistance a few times without a clear breakout The Trend line indicates where ETH has previously attempted to break out but has failed
My position is that ETH will either try to break the resistance again as it heads to the top of this Rising Wedge pattern OR it will fail to breakout and then we see it fall to the support level which is about 2100-2000 from there ETH could pump up to the Target price which is currently 2900.00
There is lower highs and higher lows being made which indicate a dip.
A Clear long Entry should be at breakout of the Trendline pattern or after the $2000 Dip.
Thanks
Marlene
Disclaimer* No financial advise given.
My position is that ETH will either try to break the resistance again as it heads to the top of this Rising Wedge pattern OR it will fail to breakout and then we see it fall to the support level which is about 2100-2000 from there ETH could pump up to the Target price which is currently 2900.00
There is lower highs and higher lows being made which indicate a dip.
A Clear long Entry should be at breakout of the Trendline pattern or after the $2000 Dip.
Thanks
Marlene
Disclaimer* No financial advise given.

免責事項
これらの情報および投稿は、TradingViewが提供または承認する金融、投資、取引、またはその他の種類の助言もしくは推奨であることを意図したものではなく、またこれらに該当するものでもありません。詳細は利用規約をご覧ください。
免責事項
これらの情報および投稿は、TradingViewが提供または承認する金融、投資、取引、またはその他の種類の助言もしくは推奨であることを意図したものではなく、またこれらに該当するものでもありません。詳細は利用規約をご覧ください。