
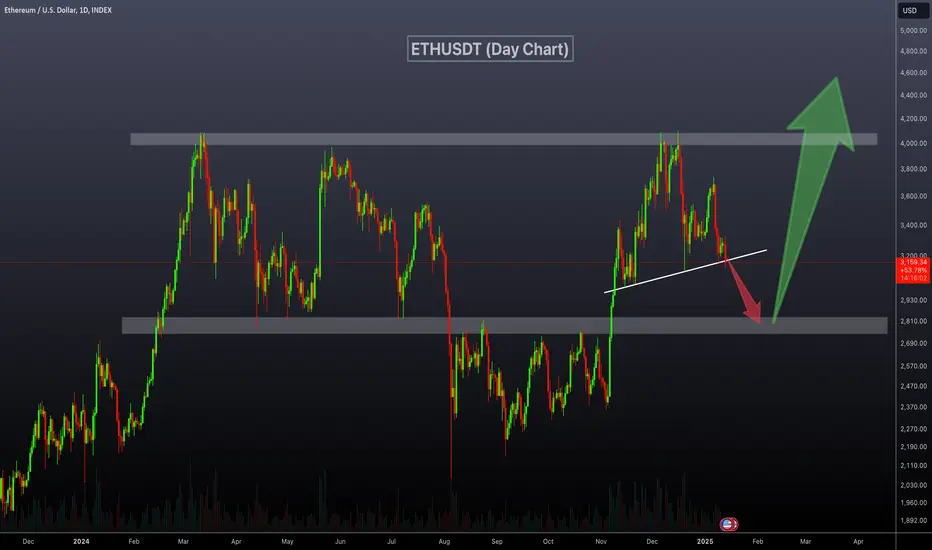
ETHUSDT Technical analysis update
ETHUSDT has been trading within the same range of $2,000–$4,000 for the past 400 days. Currently, the price is forming an inverse head and shoulders pattern. In the coming days, the price could create the right shoulder of this pattern. A possible drop to the strong support zone at $2,700–$2,800 could complete the right shoulder formation. Once the price touches this support level, we can expect a strong bounce from that area.
Good Buy level: $2700- $2800
Regards
Hexa
ETHUSDT has been trading within the same range of $2,000–$4,000 for the past 400 days. Currently, the price is forming an inverse head and shoulders pattern. In the coming days, the price could create the right shoulder of this pattern. A possible drop to the strong support zone at $2,700–$2,800 could complete the right shoulder formation. Once the price touches this support level, we can expect a strong bounce from that area.
Good Buy level: $2700- $2800
Regards
Hexa

🚀Telegram : t.me/hexatrades
🌐Website: hexatrades.io/
🗣️Twitter(X): twitter.com/HexaTrades
🌐Website: hexatrades.io/
🗣️Twitter(X): twitter.com/HexaTrades
関連の投稿
免責事項
これらの情報および投稿は、TradingViewが提供または承認する金融、投資、取引、またはその他の種類の助言もしくは推奨であることを意図したものではなく、またこれらに該当するものでもありません。詳細は利用規約をご覧ください。
🚀Telegram : t.me/hexatrades
🌐Website: hexatrades.io/
🗣️Twitter(X): twitter.com/HexaTrades
🌐Website: hexatrades.io/
🗣️Twitter(X): twitter.com/HexaTrades
関連の投稿
免責事項
これらの情報および投稿は、TradingViewが提供または承認する金融、投資、取引、またはその他の種類の助言もしくは推奨であることを意図したものではなく、またこれらに該当するものでもありません。詳細は利用規約をご覧ください。