
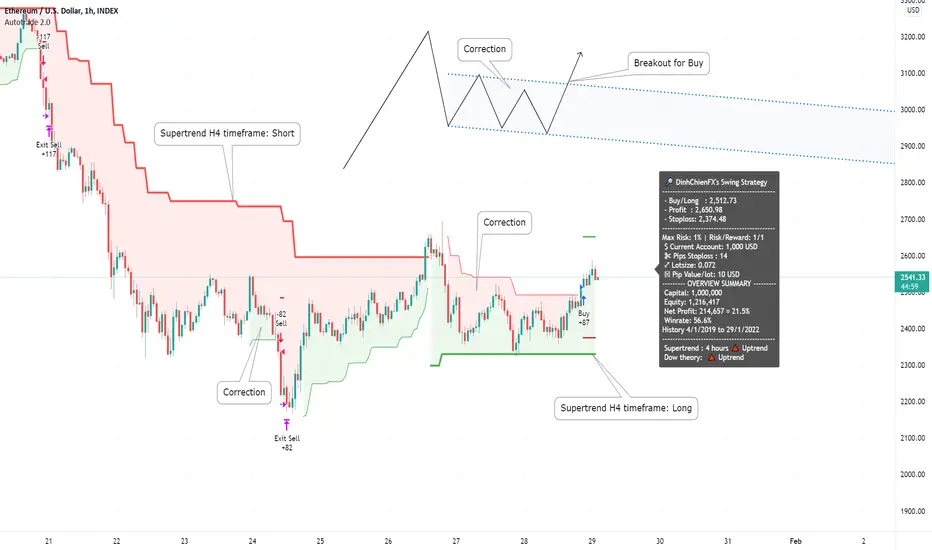
1. Main trend: Supertrend indicator at H4 timeframe.
- Uptrend when closes candles is above the green line.
- Downtrend when closes candles is below the red line.
>>> Supertrend H4 is Uptrend.
2. Corrective waves: Supertrend indicator at current timeframe.
- Uptrend when closes candles is above the green line.
- Downtrend when closes candles is below the red line.
Main trend is Long, strategy wait to a corrective wave (Short), if corrective wave are broken for Long follow the maintrend (H4).
* Commission: 0.06%/trade (Binance future).
- Do not use cross (margin).
Author uses strategy for autotrade at Binance future.
- Uptrend when closes candles is above the green line.
- Downtrend when closes candles is below the red line.
>>> Supertrend H4 is Uptrend.
2. Corrective waves: Supertrend indicator at current timeframe.
- Uptrend when closes candles is above the green line.
- Downtrend when closes candles is below the red line.
Main trend is Long, strategy wait to a corrective wave (Short), if corrective wave are broken for Long follow the maintrend (H4).
* Commission: 0.06%/trade (Binance future).
- Do not use cross (margin).
Author uses strategy for autotrade at Binance future.

免責事項
これらの情報および投稿は、TradingViewが提供または承認する金融、投資、取引、またはその他の種類の助言もしくは推奨であることを意図したものではなく、またこれらに該当するものでもありません。詳細は利用規約をご覧ください。
免責事項
これらの情報および投稿は、TradingViewが提供または承認する金融、投資、取引、またはその他の種類の助言もしくは推奨であることを意図したものではなく、またこれらに該当するものでもありません。詳細は利用規約をご覧ください。