
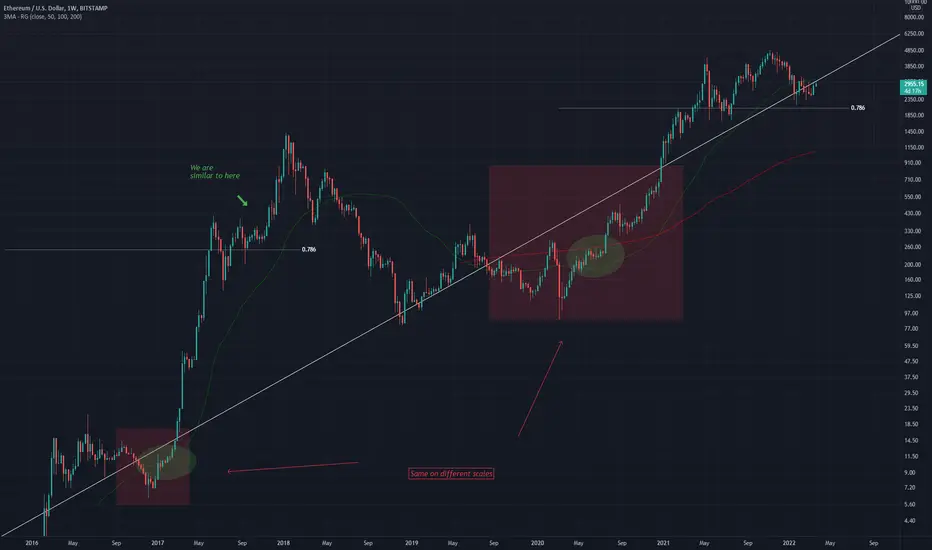
White trendline through the middle of both bull and bear cycle is dominant
using moving averages we can estimate where we are in the bull run
The red squares are similar formations, different places in time
Within the smaller square you can see the price brush against the 50MA
Within the larger square you can see the price brush against the 200MA
Using Fibonacci retracement we can see we are at 0.786 level which leaves one pump remaining until we top out for this cycle
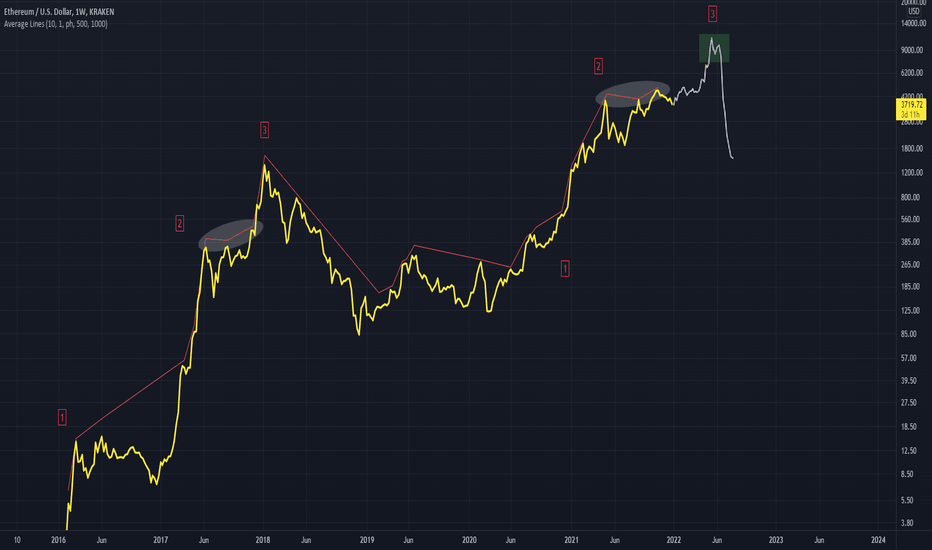
using moving averages we can estimate where we are in the bull run
The red squares are similar formations, different places in time
Within the smaller square you can see the price brush against the 50MA
Within the larger square you can see the price brush against the 200MA
Using Fibonacci retracement we can see we are at 0.786 level which leaves one pump remaining until we top out for this cycle

免責事項
これらの情報および投稿は、TradingViewが提供または承認する金融、投資、取引、またはその他の種類の助言もしくは推奨であることを意図したものではなく、またこれらに該当するものでもありません。詳細は利用規約をご覧ください。
免責事項
これらの情報および投稿は、TradingViewが提供または承認する金融、投資、取引、またはその他の種類の助言もしくは推奨であることを意図したものではなく、またこれらに該当するものでもありません。詳細は利用規約をご覧ください。