
Hi All,
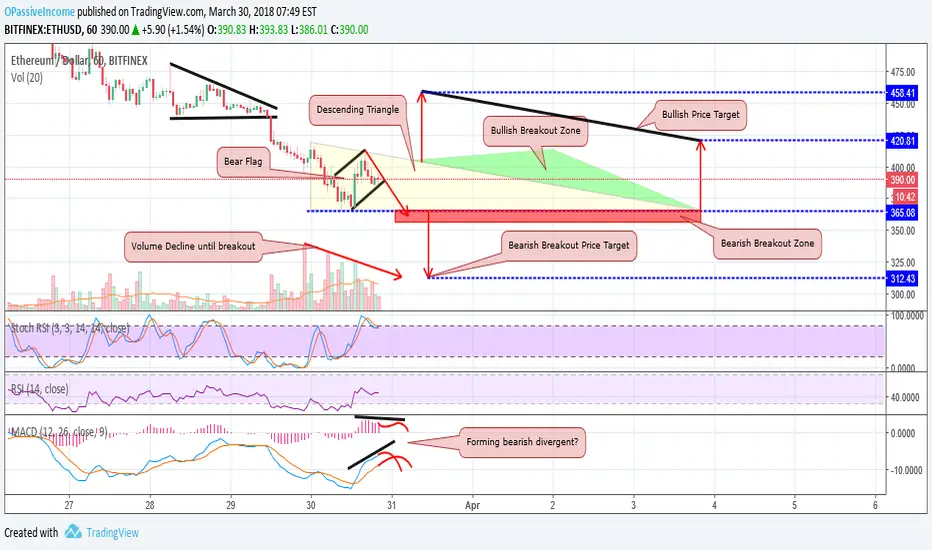
This is just a initial stage of the pattern, the pattern usually change to ascending/descending triangle and sometime to raising/ falling wedge or a channel. Just monitor on the declining of the volume until the breakout volume spike. (to identify the target price).
1. Descending Triangle - This pattern is usually a continuation pattern, but some cases, there is a breakout at the triangle resistant line.
2. Bear Flag.
3. Stoch RSI just returned from overbought
once bear flag pattern is confirmed, it will affect the MACD and form a bearish divergent. (and confirm the descending triangle bearish pattern).
This TA is for Educational purpose and not a financial advice. If you are happy with my charts and would like to follow more in the future, feel free to follow my profiles.
This is just a initial stage of the pattern, the pattern usually change to ascending/descending triangle and sometime to raising/ falling wedge or a channel. Just monitor on the declining of the volume until the breakout volume spike. (to identify the target price).
1. Descending Triangle - This pattern is usually a continuation pattern, but some cases, there is a breakout at the triangle resistant line.
2. Bear Flag.
3. Stoch RSI just returned from overbought
once bear flag pattern is confirmed, it will affect the MACD and form a bearish divergent. (and confirm the descending triangle bearish pattern).
This TA is for Educational purpose and not a financial advice. If you are happy with my charts and would like to follow more in the future, feel free to follow my profiles.

免責事項
これらの情報および投稿は、TradingViewが提供または承認する金融、投資、取引、またはその他の種類の助言もしくは推奨であることを意図したものではなく、またこれらに該当するものでもありません。詳細は利用規約をご覧ください。
免責事項
これらの情報および投稿は、TradingViewが提供または承認する金融、投資、取引、またはその他の種類の助言もしくは推奨であることを意図したものではなく、またこれらに該当するものでもありません。詳細は利用規約をご覧ください。