
Chart Pattern Analysis
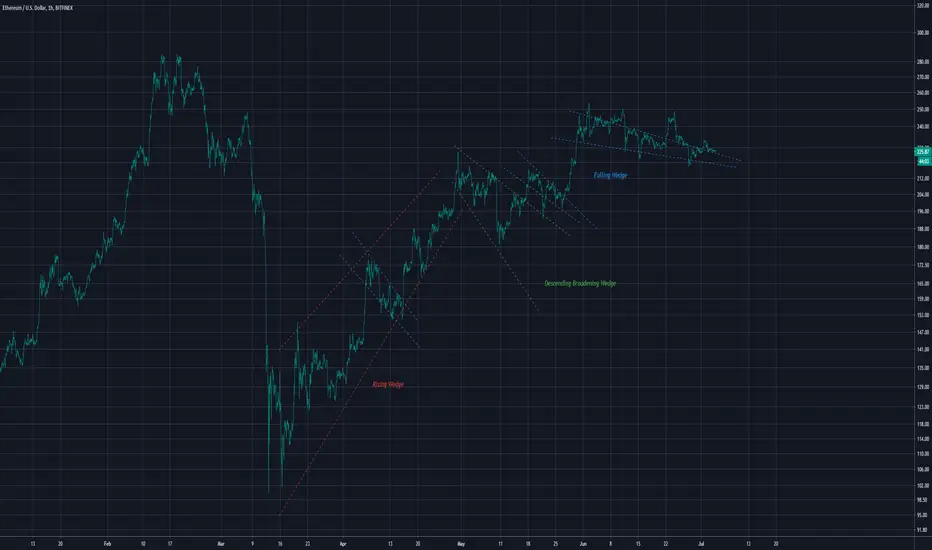
Falling Wedge - A bullish pattern that begins wide at the top and contracts. A bullish reversal pattern.
Descending Broadening Wedge - A bullish reversal pattern, Expanding cone, often mistaken for bearishness due to its downward sloping nature. But this pattern is definitely bullish. As seen on chart.
Rising Wedge - The opposite of a falling wedge, a bearish reversal pattern. Begins wide at the bottom and contracts.
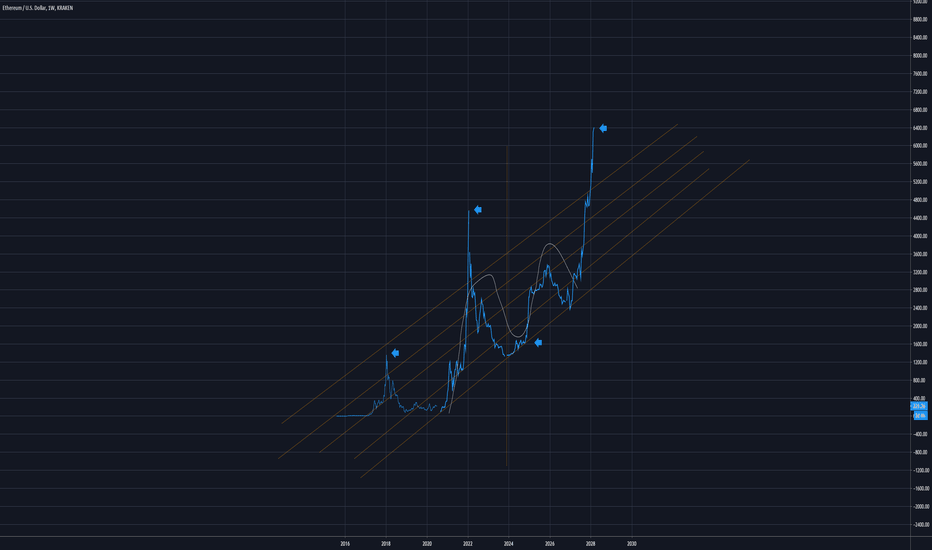
A very speculative chart for Ethereum, i just like the look of it.
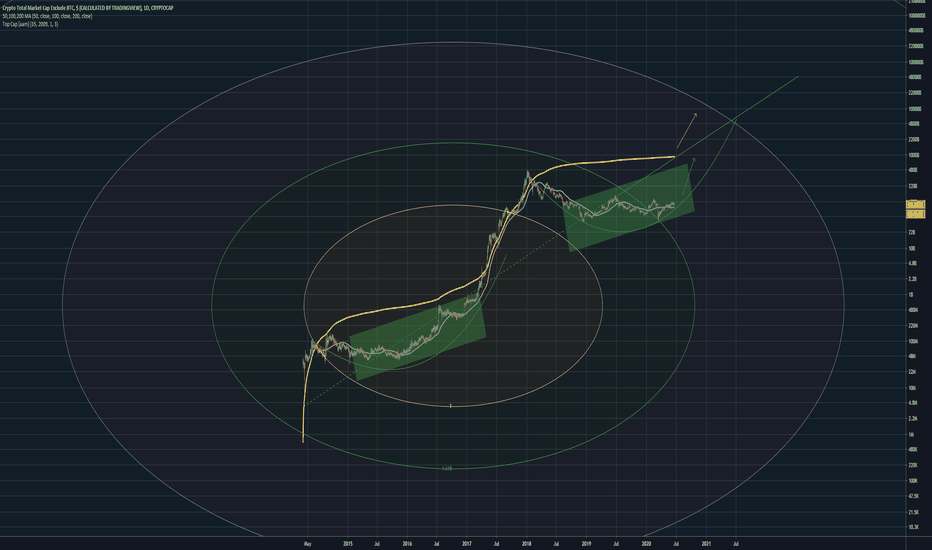
I believe The alt coin market and general cryptocurrency market is setting up for a bull run
Enjoy
Falling Wedge - A bullish pattern that begins wide at the top and contracts. A bullish reversal pattern.
Descending Broadening Wedge - A bullish reversal pattern, Expanding cone, often mistaken for bearishness due to its downward sloping nature. But this pattern is definitely bullish. As seen on chart.
Rising Wedge - The opposite of a falling wedge, a bearish reversal pattern. Begins wide at the bottom and contracts.
A very speculative chart for Ethereum, i just like the look of it.
I believe The alt coin market and general cryptocurrency market is setting up for a bull run
Enjoy

免責事項
これらの情報および投稿は、TradingViewが提供または承認する金融、投資、取引、またはその他の種類の助言もしくは推奨であることを意図したものではなく、またこれらに該当するものでもありません。詳細は利用規約をご覧ください。
免責事項
これらの情報および投稿は、TradingViewが提供または承認する金融、投資、取引、またはその他の種類の助言もしくは推奨であることを意図したものではなく、またこれらに該当するものでもありません。詳細は利用規約をご覧ください。