
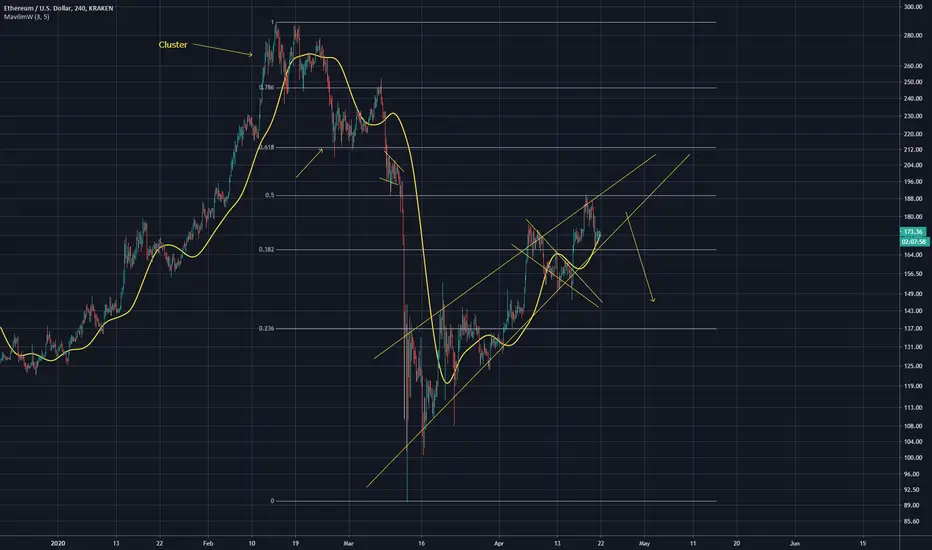
Rising Wedge formation
Bearish move expected as per chart pattern
However price is currently hovering over .382 so trade wisely
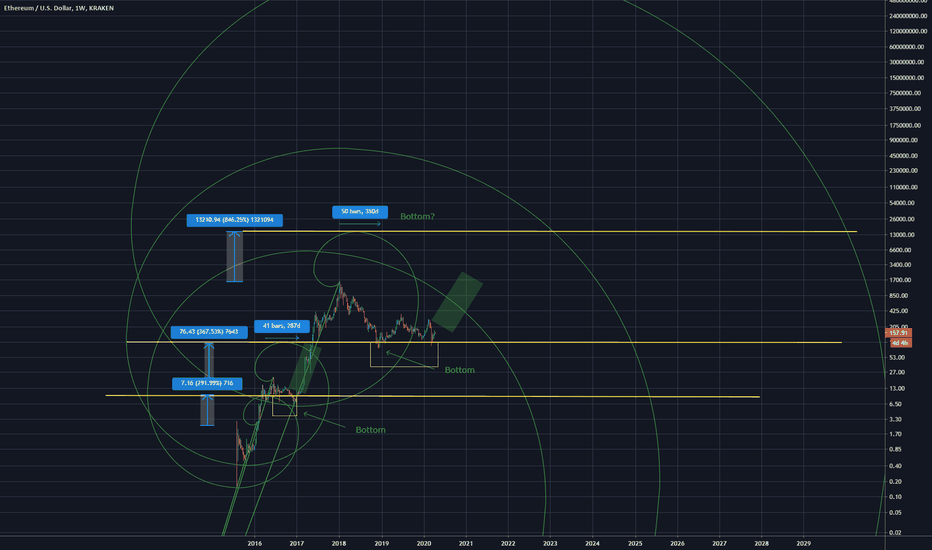
Chart for possible future bottoms (long term), ultra bullish of course
Bearish move expected as per chart pattern
However price is currently hovering over .382 so trade wisely
Chart for possible future bottoms (long term), ultra bullish of course

免責事項
これらの情報および投稿は、TradingViewが提供または承認する金融、投資、取引、またはその他の種類の助言もしくは推奨であることを意図したものではなく、またこれらに該当するものでもありません。詳細は利用規約をご覧ください。
免責事項
これらの情報および投稿は、TradingViewが提供または承認する金融、投資、取引、またはその他の種類の助言もしくは推奨であることを意図したものではなく、またこれらに該当するものでもありません。詳細は利用規約をご覧ください。