 ETHUSD
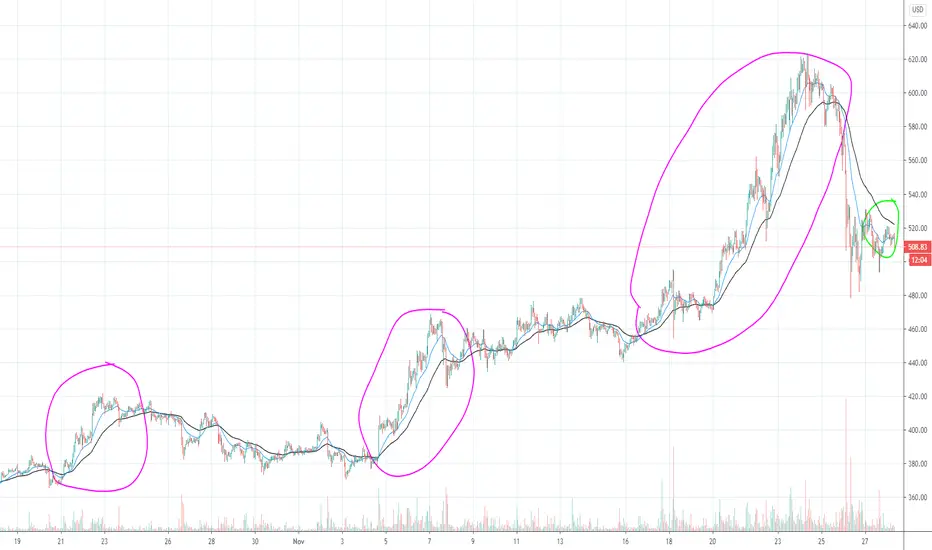
 Here is some more analysis using EMAs looking at 1 hour candles.
You can see with each pink circle, once the EMA20 (blue line) crosses above the EMA50 (black line) we enter a bullish period. This spike continues until EMAs even out and the EMA50 crosses back over. Looking at the green circle we see EMA50 is currently still above, once that turns we are bullish.
These two EMAs are very standard for cryptocurrency analysis.
This is not financial advice! Please trade at your own risk.

免責事項
これらの情報および投稿は、TradingViewが提供または承認する金融、投資、取引、またはその他の種類の助言もしくは推奨であることを意図したものではなく、またこれらに該当するものでもありません。詳細は利用規約をご覧ください。
免責事項
これらの情報および投稿は、TradingViewが提供または承認する金融、投資、取引、またはその他の種類の助言もしくは推奨であることを意図したものではなく、またこれらに該当するものでもありません。詳細は利用規約をご覧ください。