
Hi every one
Ethereum / U.S. Dollar
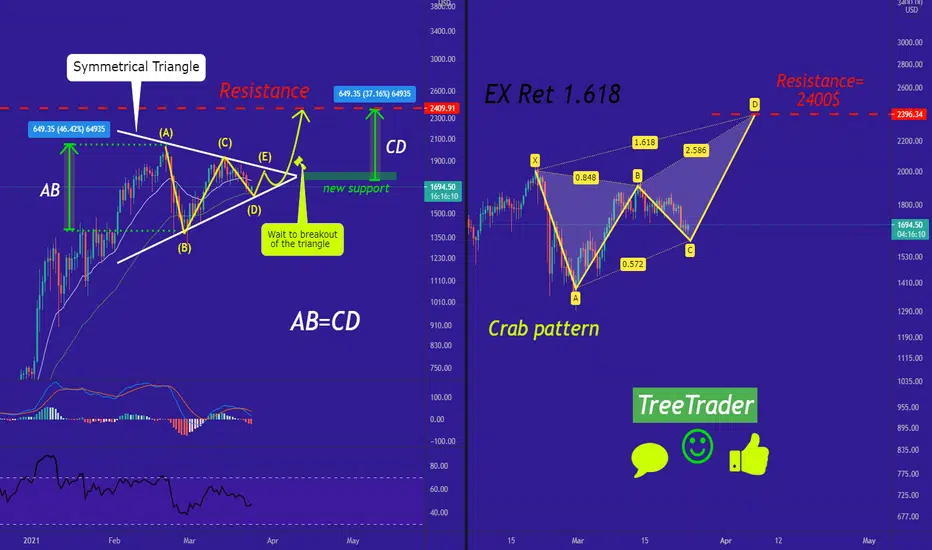
The ETH/USD situation is explained in this analysis so let's do it. The first chart shows a symmetrical triangle which has not broken yet and after the upward break out we shall see a pump in the price.(AB=CD)
The second chart shows us that if we use the crab pattern we can see that the price is about to increase and reach it's resistance which is 2400$!
Traders, if you liked this idea or have your opinion on it, write in the comments, We will be glad.
Things can change...
The markets are always changing and even with all these signals, the market changes tend to be strong and fast!!
Thank you for seeing idea .
Have a nice day and Good luck
Ethereum / U.S. Dollar
The ETH/USD situation is explained in this analysis so let's do it. The first chart shows a symmetrical triangle which has not broken yet and after the upward break out we shall see a pump in the price.(AB=CD)
The second chart shows us that if we use the crab pattern we can see that the price is about to increase and reach it's resistance which is 2400$!
Traders, if you liked this idea or have your opinion on it, write in the comments, We will be glad.
Things can change...
The markets are always changing and even with all these signals, the market changes tend to be strong and fast!!
Thank you for seeing idea .
Have a nice day and Good luck

関連の投稿
免責事項
これらの情報および投稿は、TradingViewが提供または承認する金融、投資、取引、またはその他の種類の助言もしくは推奨であることを意図したものではなく、またこれらに該当するものでもありません。詳細は利用規約をご覧ください。
免責事項
これらの情報および投稿は、TradingViewが提供または承認する金融、投資、取引、またはその他の種類の助言もしくは推奨であることを意図したものではなく、またこれらに該当するものでもありません。詳細は利用規約をご覧ください。