
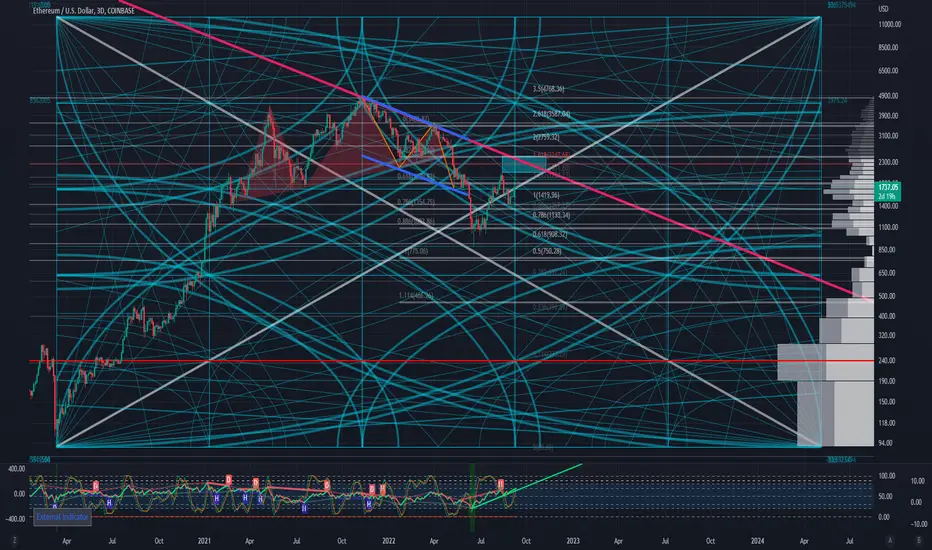
This is an elaboration of my previous idea about the ETH's resistance levels, this time using Gann Square (and arcs).
As can be seen, every arc and fan behaves as support & resistance.
White diagoanl line is Gann 1 x 1. Trends above it are sad to be strong, and trends below it are weak if the square is properly applied.
Overall, this Diagram shows how important but difficult it is for ETH to break through the two key levels: the current price zone and the previous high.
ノート
I attach the linear-scale version of the chart. The main chart is log-scaled.
The linear one is clearer on why I emphasize the resistances.
ノート
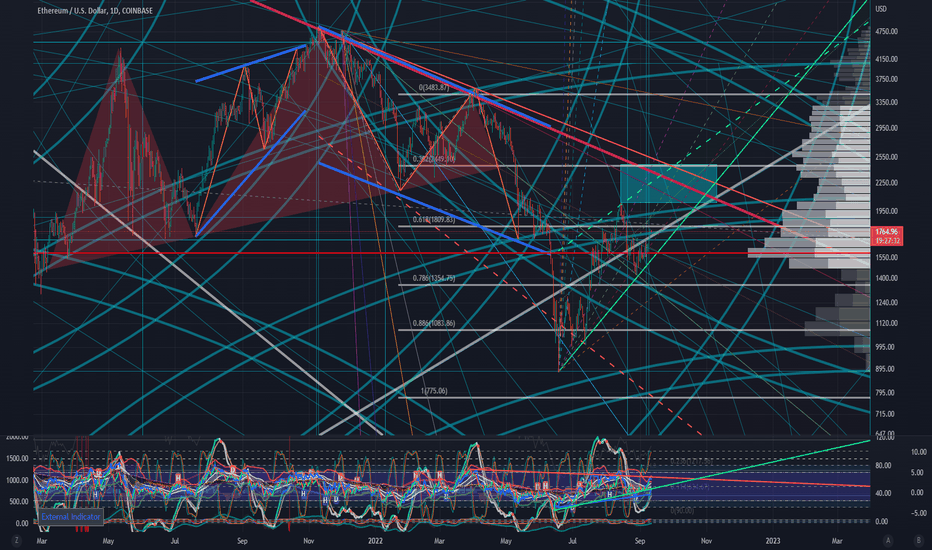
Check out the update.
Visibility improved.

関連の投稿
免責事項
これらの情報および投稿は、TradingViewが提供または承認する金融、投資、取引、またはその他の種類の助言もしくは推奨であることを意図したものではなく、またこれらに該当するものでもありません。詳細は利用規約をご覧ください。
免責事項
これらの情報および投稿は、TradingViewが提供または承認する金融、投資、取引、またはその他の種類の助言もしくは推奨であることを意図したものではなく、またこれらに該当するものでもありません。詳細は利用規約をご覧ください。