
📊 ETH/USD Market Analysis – Bullish Pullback Toward Demand 🚀
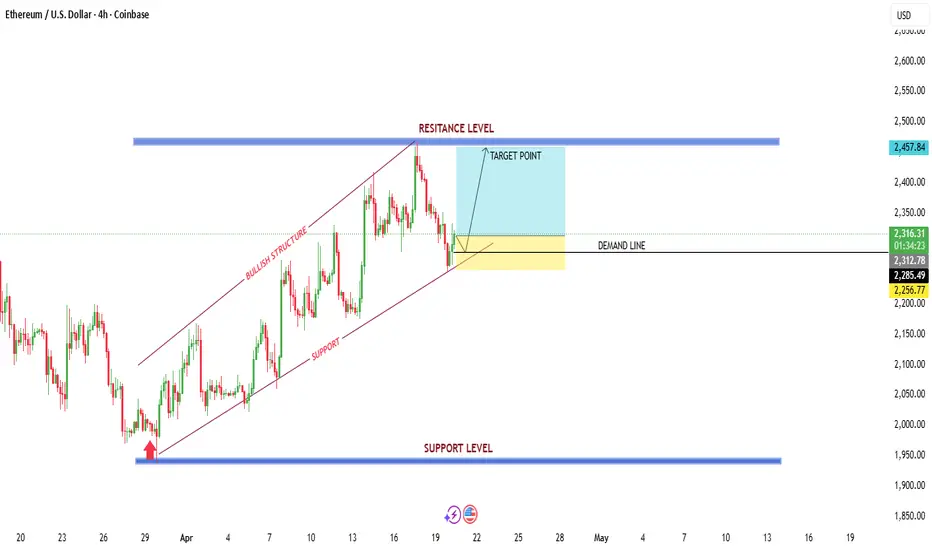
The chart shows a clear bullish structure on the 4H timeframe, with price respecting an ascending channel (higher highs & higher lows). However, recent price action suggests a healthy correction phase rather than a full trend reversal.
🔍 Key Observations
📈 Bullish Trend Intact
Price has been moving within a rising channel, confirming strong upward momentum.
🧱 Resistance Rejection
Price faced a sharp rejection from the marked resistance zone (~2450 area), indicating strong supply pressure at the top.
📉 Pullback to Demand Zone
Current retracement is approaching a demand zone (~2285–2255), which aligns with:
Previous structure support
Ascending trendline support
🔄 Potential Reversal Zone
The confluence of demand + trendline suggests a high-probability bounce area.
🎯 Trade Idea
🟢 Bullish Scenario (Preferred)
If price holds the demand zone:
Expect continuation toward target zone (~2450 resistance)
Confirmation needed via bullish candles / rejection wicks
🔴 Bearish Scenario (Invalidation)
If price breaks below demand + trendline:
Structure weakens
deeper correction toward lower support (~2000 zone)
🧠 Smart Insight
This looks like a classic “buy-the-dip” setup in an uptrend — but only if buyers defend the demand zone. Patience for confirmation is key.
⚡ Conclusion:
Market remains bullish overall, and this pullback could offer a strategic entry opportunity if support holds.
The chart shows a clear bullish structure on the 4H timeframe, with price respecting an ascending channel (higher highs & higher lows). However, recent price action suggests a healthy correction phase rather than a full trend reversal.
🔍 Key Observations
📈 Bullish Trend Intact
Price has been moving within a rising channel, confirming strong upward momentum.
🧱 Resistance Rejection
Price faced a sharp rejection from the marked resistance zone (~2450 area), indicating strong supply pressure at the top.
📉 Pullback to Demand Zone
Current retracement is approaching a demand zone (~2285–2255), which aligns with:
Previous structure support
Ascending trendline support
🔄 Potential Reversal Zone
The confluence of demand + trendline suggests a high-probability bounce area.
🎯 Trade Idea
🟢 Bullish Scenario (Preferred)
If price holds the demand zone:
Expect continuation toward target zone (~2450 resistance)
Confirmation needed via bullish candles / rejection wicks
🔴 Bearish Scenario (Invalidation)
If price breaks below demand + trendline:
Structure weakens
deeper correction toward lower support (~2000 zone)
🧠 Smart Insight
This looks like a classic “buy-the-dip” setup in an uptrend — but only if buyers defend the demand zone. Patience for confirmation is key.
⚡ Conclusion:
Market remains bullish overall, and this pullback could offer a strategic entry opportunity if support holds.
トレード稼働中
Clean structure and strong respect of demand — momentum is building and price is steadily pushing toward the target zone. Bullish bias remains intact as long as support holds. 📈

✦ MARKET STRATEGY SIGNALS ✦ 📊
Smart Money • Price Action • Precision • good entries
📲 Join Telegram: t.me/marketstrategyentry
Smart Money • Price Action • Precision • good entries
📲 Join Telegram: t.me/marketstrategyentry
関連の投稿
免責事項
これらの情報および投稿は、TradingViewが提供または承認する金融、投資、取引、またはその他の種類の助言もしくは推奨であることを意図したものではなく、またこれらに該当するものでもありません。詳細は利用規約をご覧ください。
✦ MARKET STRATEGY SIGNALS ✦ 📊
Smart Money • Price Action • Precision • good entries
📲 Join Telegram: t.me/marketstrategyentry
Smart Money • Price Action • Precision • good entries
📲 Join Telegram: t.me/marketstrategyentry
関連の投稿
免責事項
これらの情報および投稿は、TradingViewが提供または承認する金融、投資、取引、またはその他の種類の助言もしくは推奨であることを意図したものではなく、またこれらに該当するものでもありません。詳細は利用規約をご覧ください。