
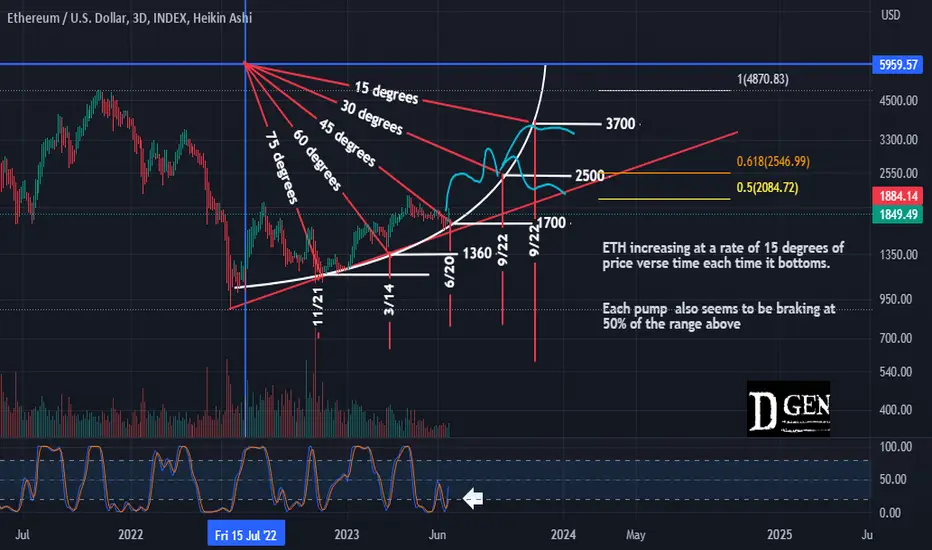
Looking at ETH on a log chart we can see that each time it has pulled back it has put in a higher bottom and each of these bottoms is exactly 15 degrees apart. This a clear indication that there a inreasing rate of momentum.
Each run since the last years bottom also seems to be braking at 50% of the range above.
If the pattern continues this would put the next uptrend target right into the technical golden pocket from the macro high.
At the same time WHEN the pattern brakes its over.
Each run since the last years bottom also seems to be braking at 50% of the range above.
If the pattern continues this would put the next uptrend target right into the technical golden pocket from the macro high.
At the same time WHEN the pattern brakes its over.
ノート
next stop 3700?
免責事項
これらの情報および投稿は、TradingViewが提供または承認する金融、投資、取引、またはその他の種類の助言もしくは推奨であることを意図したものではなく、またこれらに該当するものでもありません。詳細は利用規約をご覧ください。
免責事項
これらの情報および投稿は、TradingViewが提供または承認する金融、投資、取引、またはその他の種類の助言もしくは推奨であることを意図したものではなく、またこれらに該当するものでもありません。詳細は利用規約をご覧ください。