
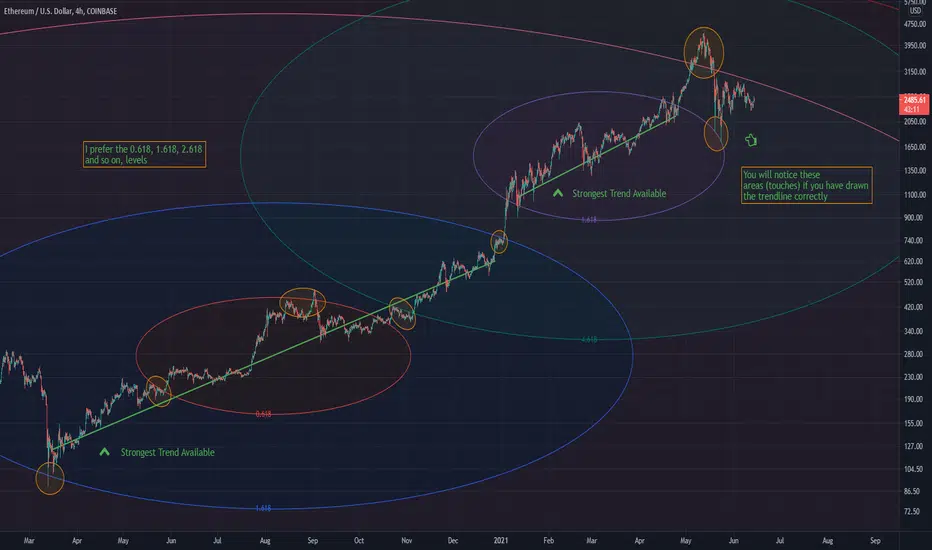
A guide for Fib circles
1 - Draw the trendline
2 - look for areas of confluence around the circle at levels for example 0.618, 1.618, 2.618, 3.618 ...
3 - Make an assessment
This is the 4Hour chart for Ethereum and isn't as reliable as using a higher timeframe, say drawing the trendlines through the entire bear market on the weekly for Ethereum would be more effective. Regardless it still serves its purpose.
This is little data for the current bull run.
This trendline drawing can be applied to any (weekly preferable) chart and assessments can be made based on the position of the price, above or below a key Fib level E.g (0.618)
Hope this helps aspiring chartists

1 - Draw the trendline
2 - look for areas of confluence around the circle at levels for example 0.618, 1.618, 2.618, 3.618 ...
3 - Make an assessment
This is the 4Hour chart for Ethereum and isn't as reliable as using a higher timeframe, say drawing the trendlines through the entire bear market on the weekly for Ethereum would be more effective. Regardless it still serves its purpose.
This is little data for the current bull run.
This trendline drawing can be applied to any (weekly preferable) chart and assessments can be made based on the position of the price, above or below a key Fib level E.g (0.618)
Hope this helps aspiring chartists

免責事項
これらの情報および投稿は、TradingViewが提供または承認する金融、投資、取引、またはその他の種類の助言もしくは推奨であることを意図したものではなく、またこれらに該当するものでもありません。詳細は利用規約をご覧ください。
免責事項
これらの情報および投稿は、TradingViewが提供または承認する金融、投資、取引、またはその他の種類の助言もしくは推奨であることを意図したものではなく、またこれらに該当するものでもありません。詳細は利用規約をご覧ください。