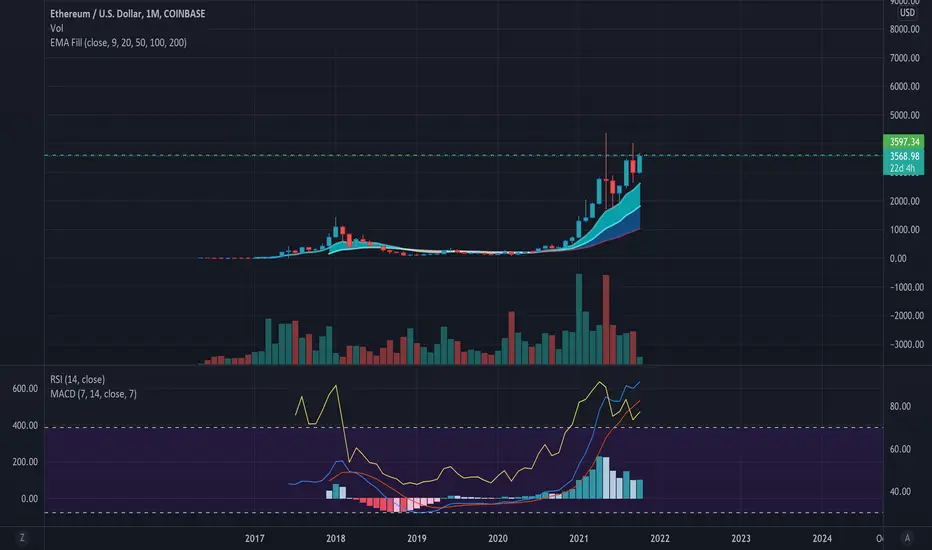
If you have a professional looking chart with plenty of fancy indicators, and yet nothing is making sense, you reached Analysis Paralysis; the rabbit hole that sucks everyone in by the gravity that every Indicator is important. In essence, they all are. The remedy to the mental confusion is to find the few that give you the best visual quality to make trading simpler. Strip the Charts back to its basics using only a handful of indicators.
The ETH chart provided uses MACD, RSI, Volume, and Script. The combination provides clear visualization of momentum, support & resistance zones and liquidity; key factors Traders need to create a trading strategy.
Majority of profitable Traders advocate the adage "Less is more!" I found this to be true in my experience.
The
ETH chart provided uses MACD, RSI, Volume, and Script. The combination provides clear visualization of momentum, support & resistance zones and liquidity; key factors Traders need to create a trading strategy. Majority of profitable Traders advocate the adage "Less is more!" I found this to be true in my experience.

免責事項
これらの情報および投稿は、TradingViewが提供または承認する金融、投資、取引、またはその他の種類の助言もしくは推奨であることを意図したものではなく、またこれらに該当するものでもありません。詳細は利用規約をご覧ください。
免責事項
これらの情報および投稿は、TradingViewが提供または承認する金融、投資、取引、またはその他の種類の助言もしくは推奨であることを意図したものではなく、またこれらに該当するものでもありません。詳細は利用規約をご覧ください。