
Hello everyone,
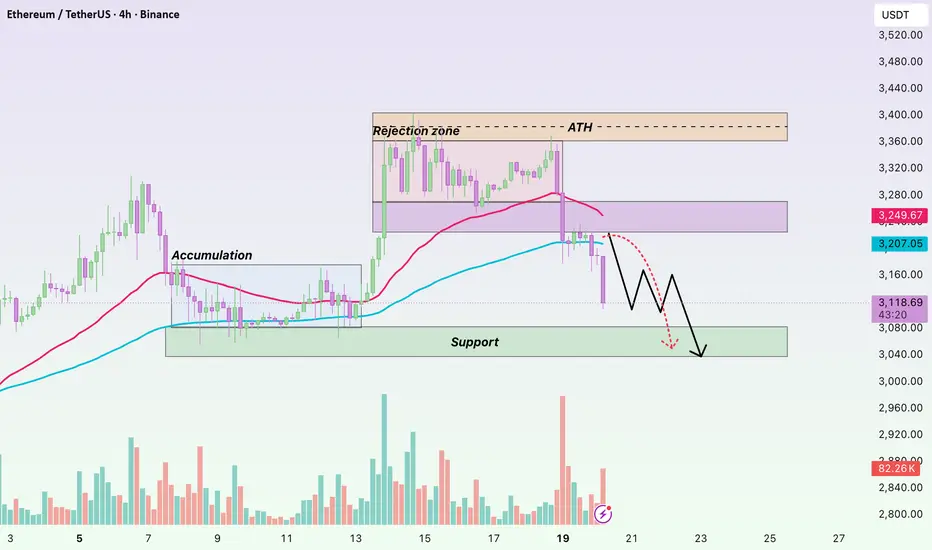
On the H4 timeframe, ETHUSDT previously experienced a very sharp and aggressive rally, with little time spent consolidating. Price was pushed almost vertically from the 3,10x area up toward 3,35x–3,40x, stretching far away from the EMA cluster in a short period. This created a strong impulsive move, but with a relatively thin price base underneath.
The issue emerged right at the top. ETH failed to maintain acceptance around the 3,35x–3,40x zone, consolidating only briefly before being clearly rejected. On the chart, this reflects a lack of acceptance — the market was not ready to value ETH at those higher levels, forcing price to rotate back toward areas with greater prior trading activity and liquidity.
Once the pullback began, EMA 34 was the first level to give way, signaling that short-term bullish momentum had ended. Price then continued sliding toward EMA 89, which represents the medium-term equilibrium of the trend. ETH stabilizing around the 3,11x–3,12x region suggests the market is mainly correcting the earlier overextended rally, rather than entering a full breakdown phase.
At this point, the key focus is the price reaction around EMA 89. If ETH can hold this zone and avoid a clear H4 close below it, the most reasonable scenario is a period of consolidation to rebuild structure, before potentially attempting a rebound to retest EMA 34.
Wishing you all a great trading session!
トレード終了: 利益確定目標に到達

Join our group and unlock real-time Forex, gold, and crypto signals — sharp insights, fast alerts, and opportunities you don’t want to miss.
Join now: t.me/+dfxDTk_DRtg4Mzll
Join now: t.me/+dfxDTk_DRtg4Mzll
関連の投稿
免責事項
これらの情報および投稿は、TradingViewが提供または承認する金融、投資、取引、またはその他の種類の助言もしくは推奨であることを意図したものではなく、またこれらに該当するものでもありません。詳細は利用規約をご覧ください。