
When we look at all cryptocurrencies in general, almost all of them draw the same graph.
Because the analysis of other cryptocurrencies independent of Btc will not give a very accurate result.
Considering that other cryptocurrencies move synchronously with btc, it is natural for the charts to resemble each other.
In fact, analyzing eth vs is nothing but analyzing btc.
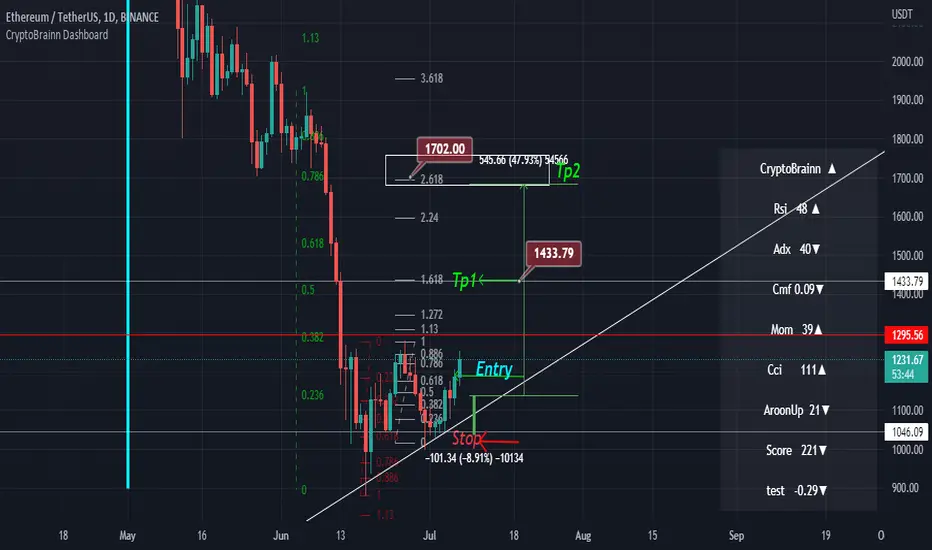
If we talk about eth now, we can think that the fib 1.13 level will be a strong resistance on the chart.
If this zone is exceeded, it is likely to face a selling reaction from nearby levels.
When we try to detect this with fibonacci, we encounter a price like 1430 dollars. He will most likely a pull back from here.
I think this price is available to day traders. I believe that the actual pull back will be at $1700 and above.
Based on my measurement, I expect fibonacci to accumulation between 2,618 and 3,618.
To me, the real sales response will come from these levels.
For $1700 and above, you can make a quick measurement and decision using simple indicators like rsi.
For example, after the price exceeds $ 1600> rsi >75 cmf> 0.20 adx> 50 will be enough for me to decide on the sale.
Note: This is not investment advice.
Because the analysis of other cryptocurrencies independent of Btc will not give a very accurate result.
Considering that other cryptocurrencies move synchronously with btc, it is natural for the charts to resemble each other.
In fact, analyzing eth vs is nothing but analyzing btc.
If we talk about eth now, we can think that the fib 1.13 level will be a strong resistance on the chart.
If this zone is exceeded, it is likely to face a selling reaction from nearby levels.
When we try to detect this with fibonacci, we encounter a price like 1430 dollars. He will most likely a pull back from here.
I think this price is available to day traders. I believe that the actual pull back will be at $1700 and above.
Based on my measurement, I expect fibonacci to accumulation between 2,618 and 3,618.
To me, the real sales response will come from these levels.
For $1700 and above, you can make a quick measurement and decision using simple indicators like rsi.
For example, after the price exceeds $ 1600> rsi >75 cmf> 0.20 adx> 50 will be enough for me to decide on the sale.
Note: This is not investment advice.

免責事項
これらの情報および投稿は、TradingViewが提供または承認する金融、投資、取引、またはその他の種類の助言もしくは推奨であることを意図したものではなく、またこれらに該当するものでもありません。詳細は利用規約をご覧ください。
免責事項
これらの情報および投稿は、TradingViewが提供または承認する金融、投資、取引、またはその他の種類の助言もしくは推奨であることを意図したものではなく、またこれらに該当するものでもありません。詳細は利用規約をご覧ください。