
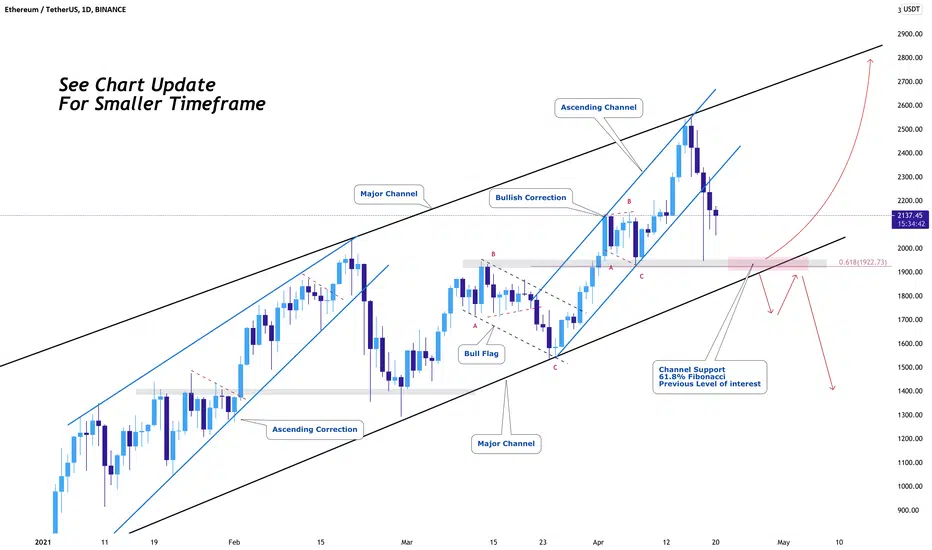
ETHUSD can be seen to be within a channel and moving in corrections and impulse. Every time the price came near channel support or resistance, it reacted aggressively. We are now seeing price approach channel support again where we have multiple confluences:
1. Channel Support
2. 61.8% fibonacci
3. Previous level where price reacted
Will wait for break of correction on a smaller timeframe. See chart update for more information
1. Channel Support
2. 61.8% fibonacci
3. Previous level where price reacted
Will wait for break of correction on a smaller timeframe. See chart update for more information
ノート
ノート

🥃 Crypto Signals Since 2017 🥃
💎Telegram t.me/AltSignals 💎
📈 Signals/Algos altsignals.io/join 📈
💎Telegram t.me/AltSignals 💎
📈 Signals/Algos altsignals.io/join 📈
関連の投稿
免責事項
これらの情報および投稿は、TradingViewが提供または承認する金融、投資、取引、またはその他の種類の助言もしくは推奨であることを意図したものではなく、またこれらに該当するものでもありません。詳細は利用規約をご覧ください。
🥃 Crypto Signals Since 2017 🥃
💎Telegram t.me/AltSignals 💎
📈 Signals/Algos altsignals.io/join 📈
💎Telegram t.me/AltSignals 💎
📈 Signals/Algos altsignals.io/join 📈
関連の投稿
免責事項
これらの情報および投稿は、TradingViewが提供または承認する金融、投資、取引、またはその他の種類の助言もしくは推奨であることを意図したものではなく、またこれらに該当するものでもありません。詳細は利用規約をご覧ください。