
Points to consider
- Initial Price Action Double Top Rejection
- Key Weekly S/R Support Respected
- RSI Swing High Exceeded
ETHUSDT Weekly Chart
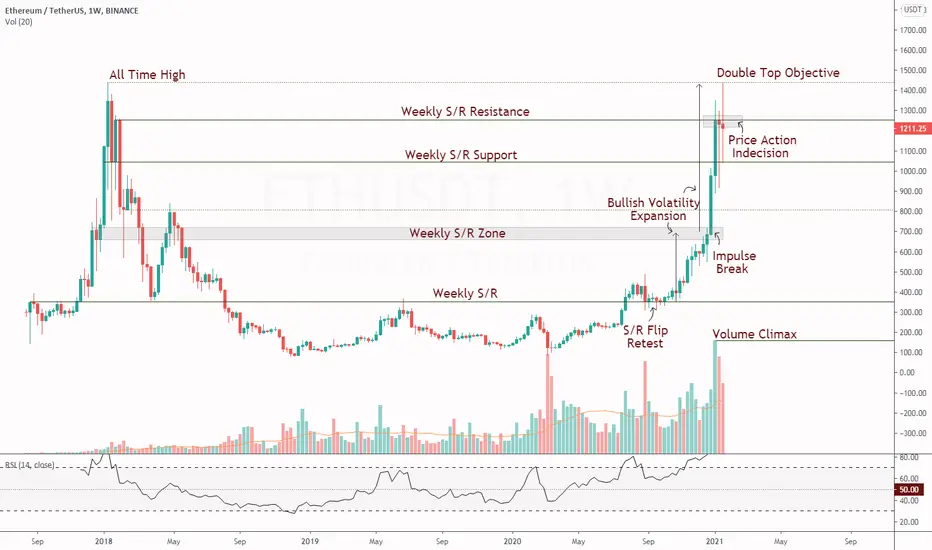
Preluding to the technical chart, ETHUSDT managed to flip lower weekly S/R by confirming an S/R Flip retest before a strong bullish volatility expansion. This initiated to a strong move that ended up testing the all-time high region. A rejection is evident as a volume climax node indicated a temporary top; this established a local double top rejection.
A bearish expansion followed suit that retested weekly S/R as support, being a critical level, it was respected on multiple attempts. This signified buyers holding lower support areas whilst sellers rejecting price at resistance leading to price action indecision. As of current price action is resting under key weekly resistance, breaching this will show strength towards to bullish case.
The current volume profile has declining volume after a climax at the key all-time high region. This is indicative of an influx coming to fruition before another expansion. Price action is likely to range between these two regions, breaking either will likely follow suit with a strong volatility move.
ETHUSDT Weekly RSI
Observing the RSI, the Swing High has clearly been breached, a back test with a hold will be indicative of strength. The momentum as of current is stored towards a bullish bias as the RSI maintains above its bullish control zone. A clear bullish expansion has been maintained since its lows, remaining in this region for an extended period of time will increase the probability of breaking the all-time high with conviction.
Hope this analysis helps when making discretionary decisions
- Initial Price Action Double Top Rejection
- Key Weekly S/R Support Respected
- RSI Swing High Exceeded
ETHUSDT Weekly Chart
Preluding to the technical chart, ETHUSDT managed to flip lower weekly S/R by confirming an S/R Flip retest before a strong bullish volatility expansion. This initiated to a strong move that ended up testing the all-time high region. A rejection is evident as a volume climax node indicated a temporary top; this established a local double top rejection.
A bearish expansion followed suit that retested weekly S/R as support, being a critical level, it was respected on multiple attempts. This signified buyers holding lower support areas whilst sellers rejecting price at resistance leading to price action indecision. As of current price action is resting under key weekly resistance, breaching this will show strength towards to bullish case.
The current volume profile has declining volume after a climax at the key all-time high region. This is indicative of an influx coming to fruition before another expansion. Price action is likely to range between these two regions, breaking either will likely follow suit with a strong volatility move.
ETHUSDT Weekly RSI
Observing the RSI, the Swing High has clearly been breached, a back test with a hold will be indicative of strength. The momentum as of current is stored towards a bullish bias as the RSI maintains above its bullish control zone. A clear bullish expansion has been maintained since its lows, remaining in this region for an extended period of time will increase the probability of breaking the all-time high with conviction.
Hope this analysis helps when making discretionary decisions

免責事項
これらの情報および投稿は、TradingViewが提供または承認する金融、投資、取引、またはその他の種類の助言もしくは推奨であることを意図したものではなく、またこれらに該当するものでもありません。詳細は利用規約をご覧ください。
免責事項
これらの情報および投稿は、TradingViewが提供または承認する金融、投資、取引、またはその他の種類の助言もしくは推奨であることを意図したものではなく、またこれらに該当するものでもありません。詳細は利用規約をご覧ください。