
Hello #SorooshSchool guys
I came back with new chart today based on your daily request
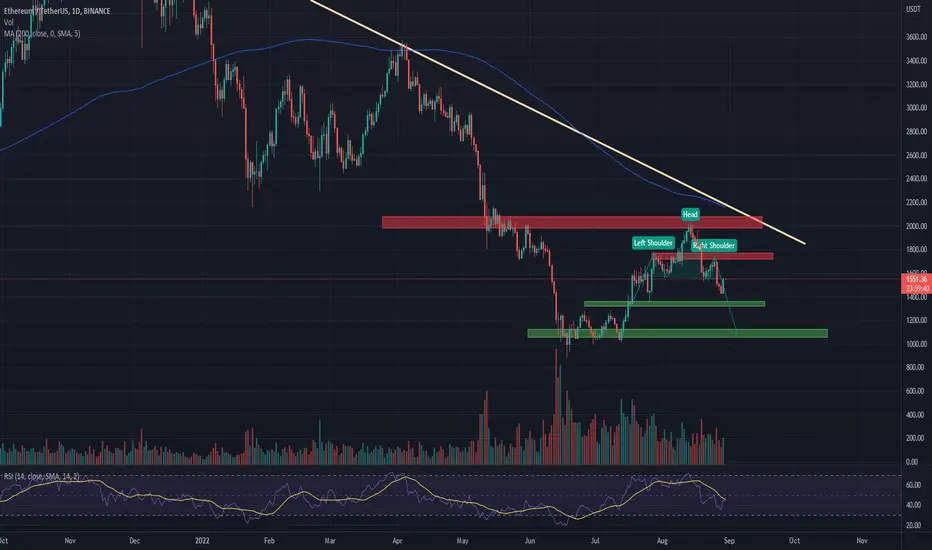
As you an see , #ETH chart in 1D is creating an head and shoulders pattern which I have recognized the important Support and resistance in the chart
Bullish scenario if #ETH broke-out the trend-line
Potential spot entry zone : 1040 , 900 , 750 if bearish scenario happened
Thank you guys
best regards
Do not forget follow us and like this idea

免責事項
これらの情報および投稿は、TradingViewが提供または承認する金融、投資、取引、またはその他の種類の助言もしくは推奨であることを意図したものではなく、またこれらに該当するものでもありません。詳細は利用規約をご覧ください。
免責事項
これらの情報および投稿は、TradingViewが提供または承認する金融、投資、取引、またはその他の種類の助言もしくは推奨であることを意図したものではなく、またこれらに該当するものでもありません。詳細は利用規約をご覧ください。