
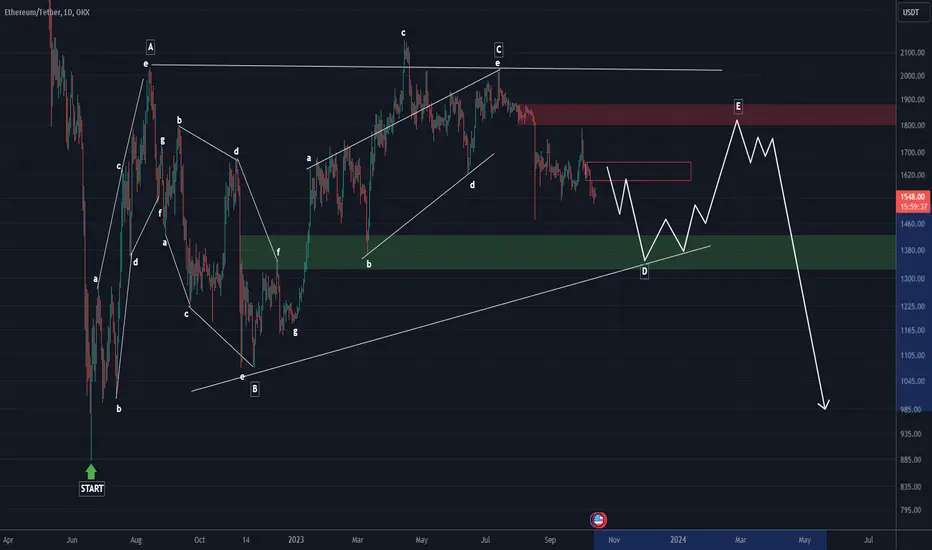
By examining the waves of Ethereum, it seems that the fluctuations of the last 484 days of Ethereum are inside a descending triangle.
What this scenario makes clear to me is that
Now we should be inside the D wave of this triangle.
It seems that after the completion of wave D and E, we will see a heavy drop towards the lower areas.
In order to confirm this scenario, it is necessary to form complete wave D and E, and then in the final wave, i.e. wave E, we will get confirmations of the fall.
I have such a view on Ethereum.
What this scenario makes clear to me is that
Now we should be inside the D wave of this triangle.
It seems that after the completion of wave D and E, we will see a heavy drop towards the lower areas.
In order to confirm this scenario, it is necessary to form complete wave D and E, and then in the final wave, i.e. wave E, we will get confirmations of the fall.
I have such a view on Ethereum.

✅ Join our Telegram channel to succeed in crypto trading.
💎Our CRYPTO Telegram Channel: 👉 t.me/Behdark_EN
💎Our FOREX Telegram Channel: 👉 t.me/FX_Behdark
💎Our CRYPTO Telegram Channel: 👉 t.me/Behdark_EN
💎Our FOREX Telegram Channel: 👉 t.me/FX_Behdark
免責事項
これらの情報および投稿は、TradingViewが提供または承認する金融、投資、取引、またはその他の種類の助言もしくは推奨であることを意図したものではなく、またこれらに該当するものでもありません。詳細は利用規約をご覧ください。
✅ Join our Telegram channel to succeed in crypto trading.
💎Our CRYPTO Telegram Channel: 👉 t.me/Behdark_EN
💎Our FOREX Telegram Channel: 👉 t.me/FX_Behdark
💎Our CRYPTO Telegram Channel: 👉 t.me/Behdark_EN
💎Our FOREX Telegram Channel: 👉 t.me/FX_Behdark
免責事項
これらの情報および投稿は、TradingViewが提供または承認する金融、投資、取引、またはその他の種類の助言もしくは推奨であることを意図したものではなく、またこれらに該当するものでもありません。詳細は利用規約をご覧ください。