
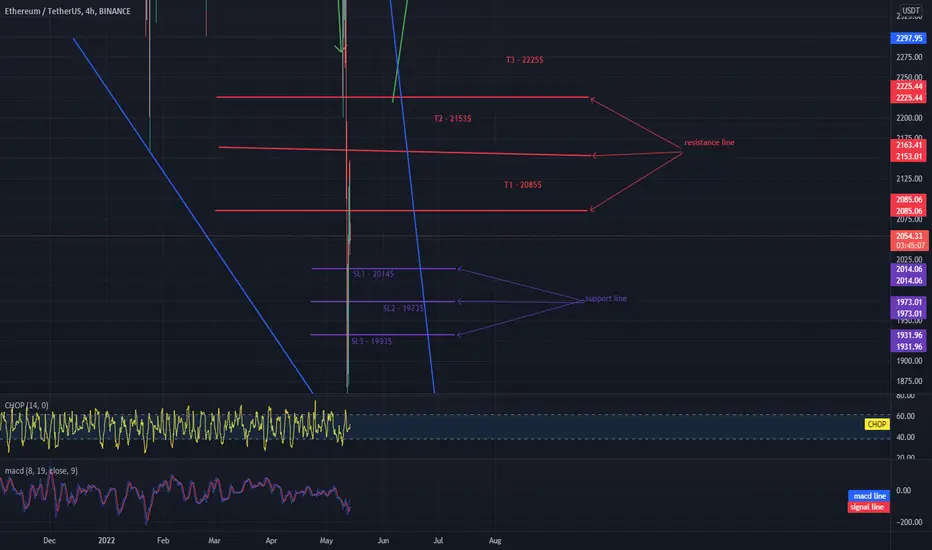
Hello everyone, let's take a look at the ETH to USDT chart over the 4 hour timeframe. As you can see, the price is moving in the triangle of the downturn channel.
Let's start by designating short term stop losses, as you can see:
SL1 - $ 2014,
SL2 - $ 1973
and
SL3 - $ 1933.
Now let's move on to determining the targets that we should take into account in the coming hours:
T1 - $ 2,085,
T2 - $ 2,153
and
T3 - $ 2,225.
Looking at the CHOP indicator, we can see that at the 4H interval, the energy starts to rise again, while the MACD indicator shows an uptrend.
Let's start by designating short term stop losses, as you can see:
SL1 - $ 2014,
SL2 - $ 1973
and
SL3 - $ 1933.
Now let's move on to determining the targets that we should take into account in the coming hours:
T1 - $ 2,085,
T2 - $ 2,153
and
T3 - $ 2,225.
Looking at the CHOP indicator, we can see that at the 4H interval, the energy starts to rise again, while the MACD indicator shows an uptrend.

免責事項
これらの情報および投稿は、TradingViewが提供または承認する金融、投資、取引、またはその他の種類の助言もしくは推奨であることを意図したものではなく、またこれらに該当するものでもありません。詳細は利用規約をご覧ください。
免責事項
これらの情報および投稿は、TradingViewが提供または承認する金融、投資、取引、またはその他の種類の助言もしくは推奨であることを意図したものではなく、またこれらに該当するものでもありません。詳細は利用規約をご覧ください。