
More exclusive indicators from BigBeluga
Subscribe to BigBeluga Premium for $66.47/month to get exclusive indicators by this author. You pay right on TradingView and can use them on your charts straight away.
Explore BigBeluga PremiumLesson 6 - Fibonacci with Elliott
Difficulty: (Intermediate)
Wave counting tells you where you are in the structure. Fibonacci tells you how far the next leg might travel. On their own, each one leaves a gap — a count with no measurement, or a set of levels with no context. Used together, they answer two different questions at the same time.

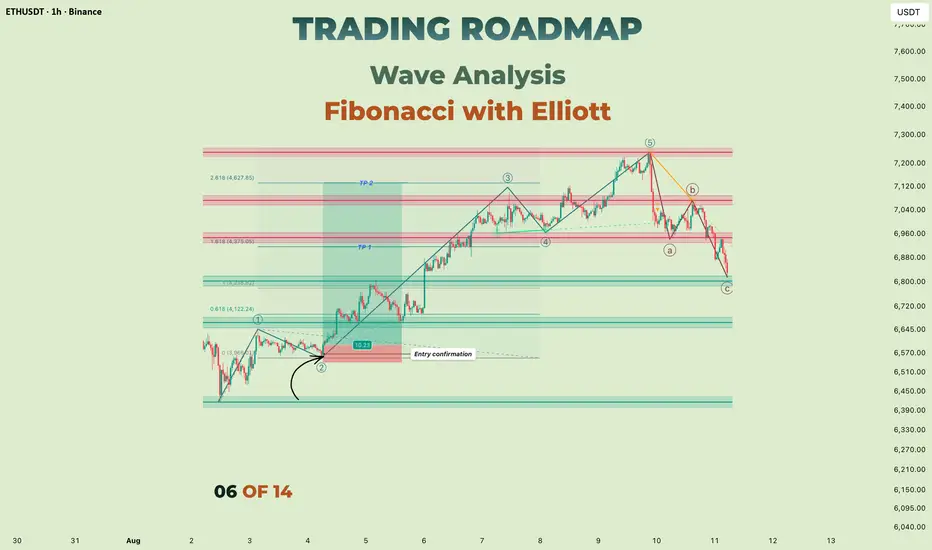
A completed five-wave advance followed by an A-B-C correction. Before any measurement is added, the count has to survive the rules from Lesson 4 — Wave 2 held above the start of Wave 1, Wave 3 is the longest motive leg, and Wave 4 stayed well clear of Wave 1's territory. Everything that follows is measured on this same sequence.
🔵 QUICK RECAP FROM LESSON 5
Each wave tends to carry its own character — Wave 3 broad and heavily participated, Wave 4 slow and sideways, Wave 5 making a new extreme on thinner conviction.
Personality helps you rank counts that all remain valid. This lesson adds the measuring layer: once a count is chosen, where might the next leg reasonably reach, and where would the whole idea stop making sense.
🔵 1. WHY THE TWO FRAMEWORKS SIT TOGETHER
Elliott's structure describes sequence — which leg comes next and what shape it usually takes. Fibonacci ratios describe proportion — how the legs tend to relate in size.
Neither one predicts. Both give you a framework to prepare with.
- A count without measurement gives you direction but no target and no defined risk
- Levels without a count give you a grid of prices with no reason to prefer one over another
- Together, they let you say: if this is a Wave 4, this zone matters, and this level would invalidate it
If you have not read Classical TA · Lesson 12 on drawing Fibonacci, this lesson assumes you can already place a retracement correctly.
🐳 Pro Tip: Fibonacci does not confirm a count. If the three rules from Lesson 4 are broken, no ratio hit repairs it.
🔵 2. THREE TOOLS, THREE DIFFERENT JOBS
A lot of confusion around Fibonacci in wave analysis comes from mixing up which tool does what.
- Retracement (two points) — measures how much of a completed leg is given back. Used for Wave 2, Wave 4 and Wave B
- Projection / Trend-Based Extension (three points) — measures a completed leg and projects that distance forward from a different starting point. Used for Wave 3, Wave 5 and Wave C
- Extension beyond 100% — the same projection tool, read above 1.0, for legs that travel further than the one they are measured against
Retracement looks backwards inside a move. Projection looks forwards from the end of a correction. Using the wrong one is one of the more common reasons targets come out looking strange.
🐳 Pro Tip: Before you draw anything, say out loud which question you are asking. "How much was given back" is a retracement. "How far might this run" is a projection. The tool follows from the question, not the other way round.
🔵 3. WAVE 2 — RETRACEMENT ZONES
Wave 2 is measured against Wave 1, from the start of Wave 1 to its end.
- 50% – 61.8% is the zone that comes up most often
- 78.6% appears regularly on sharper second waves and is still perfectly valid
- Shallower second waves — around 38.2% — do happen, and they are worth a second look rather than an automatic rejection
- Anything beyond 100% breaks Rule 1 from Lesson 4 — at that point the count needs rethinking, not stretching

Wave 2 here bottomed just past the 38.2% line — shallower than the area that comes up most often. The count still stands, because validity is decided by the rule, not the ratio: the 100% line sits at the origin of Wave 1 and was never approached. Ratios describe tendencies; rules decide.
🐳 Pro Tip: The 100% line of your Wave 2 retracement is also your invalidation level. Drawing the retracement gives you the target zone and the risk boundary in the same action.
🔵 4. WAVE 4 — THE SHALLOWER SIDE
Wave 4 is measured against Wave 3, and it typically retraces far less than Wave 2 did.
- 23.6% – 38.2% is the range most commonly cited
- 50% shows up on deeper fourth waves and does not break anything on its own
- The Wave 1 high still marks the boundary from Rule 3 — a retracement zone that sits inside Wave 1 territory is a warning that the count may need a different degree
This is where alternation from Lesson 5 becomes practical: when Wave 2 is sharp, a shallow and sideways Wave 4 is the more typical companion.

Wave 4 turned almost exactly on the 23.6% line — the shallow edge of the range described above, and a long way from Wave 1's territory. Compared with the second wave, the two corrections in this sequence gave back very different amounts of the leg before them.
🐳 Pro Tip: If a supposed Wave 4 retraces more than roughly 50% of Wave 3, it is worth testing an alternative count before assuming the impulse is still intact.
🔵 5. WAVE 3 — PROJECTING FORWARD
Wave 3 is projected from Wave 1: measure Wave 1, then anchor the projection at the end of Wave 2.
- 1.618 of Wave 1 is the ratio most often associated with a third wave
- 2.618 and beyond appear when Wave 3 is the extended wave — the subject of Lesson 7
- A Wave 3 that fails to exceed 1.0 of Wave 1 is unusual, and combined with Rule 2 it is worth double-checking
Treat these as zones to watch rather than exit prices. Third waves are the legs most likely to run past a projection, which is precisely why holding a position through one is difficult.

The third wave passed 1.618 without pausing and stalled a little under 2.618. Neither line was touched precisely — which is the normal outcome. A projection marks an area where the leg may begin to run out of room, not a price where it has to stop.
🐳 Pro Tip: When Wave 3 reaches 1.618 and momentum stays broad, that is not automatically a top — it is a level where partial management can be considered while the structure keeps its own count.
🔵 6. WAVE 5 — PROJECTING THE FINAL LEG
Wave 5 is most commonly measured against Wave 1: take Wave 1's length and project it from the end of Wave 4.
- 1.0 — equality with Wave 1 — is the reading used most often, and comes up frequently when Wave 3 was the extended wave
- 0.618 is common when Wave 5 is running on thinner participation
- An alternative approach measures from the start of Wave 1 to the end of Wave 3, then projects 0.382 or 0.618 of that distance from the Wave 4 low
When two approaches point at a similar area, that area is worth marking. When they are far apart, the count may be at a different degree than assumed.

Equality with Wave 1 landed inside the range where the advance began to stall, and the final high came a little above it. That overshoot is ordinary — these projections describe where a leg may be maturing, not a ceiling it is obliged to respect.
🐳 Pro Tip: Pair the Wave 5 projection with the momentum divergence from Lesson 5. Neither is a signal alone; together they describe a sequence that may be maturing.
🔵 7. MEASURING THE CORRECTION — A, B AND C
The A-B-C structures from Lesson 3 respond to the same tools.
- Wave B in a zigzag commonly retraces 38.2% – 61.8% of Wave A; in a flat it can reach 90% or more
- Wave C is usually projected from Wave A: 1.0 (equality) and 1.618 are the two readings most often used
- When Wave C reaches equality with Wave A near a retracement level of the larger impulse, that overlap is the kind of confluence worth marking on the chart
🐳 Pro Tip: A "B wave" that retraces more than 100% of A is not necessarily wrong — but the labels may need to move. Expanding flats are covered later in the course.
🔵 8. WHERE, AND WHEN
Fibonacci answers where might this leg reach. It does not answer has the turn actually happened. For that, most traders reach for something structural — and a trendline is the simplest version of it.
Two places it shows up in a wave sequence:
- Ending an impulse: a rising line along the pullback lows inside Wave 5. While it holds, the fifth wave is still building. When it gives way, the first corrective leg is often already underway — which is usually how a Wave A gets identified in real time rather than in hindsight
- Ending a correction: a descending line along the highs of the A-B-C. A break above it can be the first sign the correction may be complete, and it tends to arrive before any wave label can be confirmed

The rising line that had been holding the pullbacks inside Wave 5 gave way shortly after the high. The projection had already marked the area; the break is what turned it into something you could act on.
Neither break confirms a count on its own. What they add is timing — the projection gives you the area, the break gives you a moment to react to.

The same idea applied to the correction. While this descending line holds, the A-B-C can still be extending; a decisive move above it would be the first structural argument that the correction may be finishing.
🐳 Pro Tip: The projection and the trendline break rarely happen at the same instant. When the break comes far from any zone you had marked, it is more likely noise. When it comes inside that zone, the two are describing the same event from different angles.
🔵 9. CONFLUENCE WITHOUT LEVEL-HUNTING
The risk with Fibonacci is that enough levels on a chart will eventually cover every price. A few habits keep it disciplined.
1. Draw only the measurement the current question needs — one retracement or one projection, not five
2. Prefer zones where a Fib level overlaps something independent: a horizontal level from prior structure, a channel boundary, a moving average
3. Keep the invalidation levels from Lesson 4 visible at all times
4. Remove drawings that belong to a count you have already discarded
A level that matters usually has a reason to matter beyond the ratio itself.
🐳 Pro Tip: Horizontal levels built from prior structure are useful here precisely because they come from something other than wave ratios. When a retracement zone lands on a level that was already on the chart before you measured anything, the two are agreeing independently — a more meaningful kind of agreement than stacking more ratios on top of each other.
🔵 COMMON MISTAKES
- Using a retracement where a three-point projection is needed, or the reverse
- Anchoring a Wave 3 projection at the start of Wave 1 instead of the end of Wave 2
- Treating a ratio hit as confirmation while a rule from Lesson 4 is already broken
- Discarding a valid count because a retracement came in shallower or deeper than expected
- Leaving every Fibonacci level on the chart until nothing stands out
- Expecting exact touches — ratios describe zones, and overshoots are normal
- Adjusting the anchors after the fact so the level matches where price already went
🔵 QUICK SELF-CHECK
- Explain in one sentence when you would use a retracement and when you would use a projection
- Open a completed impulse and measure how much of Wave 1 the second wave gave back
- On the same chart, check where Wave 3 landed relative to 1.618 and 2.618
- Project Wave 5 from the Wave 4 low and see how close equality came to the actual high
- Draw the line along the Wave 5 pullback lows and find where it broke
- Identify the single level that would invalidate the count
🔵 WHAT IS NEXT
Lesson 7 — Extended Waves: one motive wave in an impulse is usually longer than the others. We look at which wave tends to extend, what changes when it does, and how the measurements in this lesson shift once an extension is underway.
Which Fibonacci measurement do you rely on most — and which one has misled you?
Full Trading Roadmap | Wave Analysis Course
Trading Roadmap | Wave Analysis · Lesson 01 — Wave Analysis Foundations
Trading Roadmap | Wave Analysis · Lesson 02 — Impulse Waves (5-Wave Structure)
Trading Roadmap | Wave Analysis · Lesson 03 — Corrective Waves (A-B-C)
Trading Roadmap | Wave Analysis · Lesson 04 — The Rules of Elliott
Trading Roadmap | Wave Analysis · Lesson 05 — Wave Personality
Best Regards, BigBeluga 🐳
Difficulty: (Intermediate)
Wave counting tells you where you are in the structure. Fibonacci tells you how far the next leg might travel. On their own, each one leaves a gap — a count with no measurement, or a set of levels with no context. Used together, they answer two different questions at the same time.
A completed five-wave advance followed by an A-B-C correction. Before any measurement is added, the count has to survive the rules from Lesson 4 — Wave 2 held above the start of Wave 1, Wave 3 is the longest motive leg, and Wave 4 stayed well clear of Wave 1's territory. Everything that follows is measured on this same sequence.
🔵 QUICK RECAP FROM LESSON 5
Each wave tends to carry its own character — Wave 3 broad and heavily participated, Wave 4 slow and sideways, Wave 5 making a new extreme on thinner conviction.
Personality helps you rank counts that all remain valid. This lesson adds the measuring layer: once a count is chosen, where might the next leg reasonably reach, and where would the whole idea stop making sense.
🔵 1. WHY THE TWO FRAMEWORKS SIT TOGETHER
Elliott's structure describes sequence — which leg comes next and what shape it usually takes. Fibonacci ratios describe proportion — how the legs tend to relate in size.
Neither one predicts. Both give you a framework to prepare with.
- A count without measurement gives you direction but no target and no defined risk
- Levels without a count give you a grid of prices with no reason to prefer one over another
- Together, they let you say: if this is a Wave 4, this zone matters, and this level would invalidate it
If you have not read Classical TA · Lesson 12 on drawing Fibonacci, this lesson assumes you can already place a retracement correctly.
🐳 Pro Tip: Fibonacci does not confirm a count. If the three rules from Lesson 4 are broken, no ratio hit repairs it.
🔵 2. THREE TOOLS, THREE DIFFERENT JOBS
A lot of confusion around Fibonacci in wave analysis comes from mixing up which tool does what.
- Retracement (two points) — measures how much of a completed leg is given back. Used for Wave 2, Wave 4 and Wave B
- Projection / Trend-Based Extension (three points) — measures a completed leg and projects that distance forward from a different starting point. Used for Wave 3, Wave 5 and Wave C
- Extension beyond 100% — the same projection tool, read above 1.0, for legs that travel further than the one they are measured against
Retracement looks backwards inside a move. Projection looks forwards from the end of a correction. Using the wrong one is one of the more common reasons targets come out looking strange.
🐳 Pro Tip: Before you draw anything, say out loud which question you are asking. "How much was given back" is a retracement. "How far might this run" is a projection. The tool follows from the question, not the other way round.
🔵 3. WAVE 2 — RETRACEMENT ZONES
Wave 2 is measured against Wave 1, from the start of Wave 1 to its end.
- 50% – 61.8% is the zone that comes up most often
- 78.6% appears regularly on sharper second waves and is still perfectly valid
- Shallower second waves — around 38.2% — do happen, and they are worth a second look rather than an automatic rejection
- Anything beyond 100% breaks Rule 1 from Lesson 4 — at that point the count needs rethinking, not stretching
Wave 2 here bottomed just past the 38.2% line — shallower than the area that comes up most often. The count still stands, because validity is decided by the rule, not the ratio: the 100% line sits at the origin of Wave 1 and was never approached. Ratios describe tendencies; rules decide.
🐳 Pro Tip: The 100% line of your Wave 2 retracement is also your invalidation level. Drawing the retracement gives you the target zone and the risk boundary in the same action.
🔵 4. WAVE 4 — THE SHALLOWER SIDE
Wave 4 is measured against Wave 3, and it typically retraces far less than Wave 2 did.
- 23.6% – 38.2% is the range most commonly cited
- 50% shows up on deeper fourth waves and does not break anything on its own
- The Wave 1 high still marks the boundary from Rule 3 — a retracement zone that sits inside Wave 1 territory is a warning that the count may need a different degree
This is where alternation from Lesson 5 becomes practical: when Wave 2 is sharp, a shallow and sideways Wave 4 is the more typical companion.
Wave 4 turned almost exactly on the 23.6% line — the shallow edge of the range described above, and a long way from Wave 1's territory. Compared with the second wave, the two corrections in this sequence gave back very different amounts of the leg before them.
🐳 Pro Tip: If a supposed Wave 4 retraces more than roughly 50% of Wave 3, it is worth testing an alternative count before assuming the impulse is still intact.
🔵 5. WAVE 3 — PROJECTING FORWARD
Wave 3 is projected from Wave 1: measure Wave 1, then anchor the projection at the end of Wave 2.
- 1.618 of Wave 1 is the ratio most often associated with a third wave
- 2.618 and beyond appear when Wave 3 is the extended wave — the subject of Lesson 7
- A Wave 3 that fails to exceed 1.0 of Wave 1 is unusual, and combined with Rule 2 it is worth double-checking
Treat these as zones to watch rather than exit prices. Third waves are the legs most likely to run past a projection, which is precisely why holding a position through one is difficult.
The third wave passed 1.618 without pausing and stalled a little under 2.618. Neither line was touched precisely — which is the normal outcome. A projection marks an area where the leg may begin to run out of room, not a price where it has to stop.
🐳 Pro Tip: When Wave 3 reaches 1.618 and momentum stays broad, that is not automatically a top — it is a level where partial management can be considered while the structure keeps its own count.
🔵 6. WAVE 5 — PROJECTING THE FINAL LEG
Wave 5 is most commonly measured against Wave 1: take Wave 1's length and project it from the end of Wave 4.
- 1.0 — equality with Wave 1 — is the reading used most often, and comes up frequently when Wave 3 was the extended wave
- 0.618 is common when Wave 5 is running on thinner participation
- An alternative approach measures from the start of Wave 1 to the end of Wave 3, then projects 0.382 or 0.618 of that distance from the Wave 4 low
When two approaches point at a similar area, that area is worth marking. When they are far apart, the count may be at a different degree than assumed.
Equality with Wave 1 landed inside the range where the advance began to stall, and the final high came a little above it. That overshoot is ordinary — these projections describe where a leg may be maturing, not a ceiling it is obliged to respect.
🐳 Pro Tip: Pair the Wave 5 projection with the momentum divergence from Lesson 5. Neither is a signal alone; together they describe a sequence that may be maturing.
🔵 7. MEASURING THE CORRECTION — A, B AND C
The A-B-C structures from Lesson 3 respond to the same tools.
- Wave B in a zigzag commonly retraces 38.2% – 61.8% of Wave A; in a flat it can reach 90% or more
- Wave C is usually projected from Wave A: 1.0 (equality) and 1.618 are the two readings most often used
- When Wave C reaches equality with Wave A near a retracement level of the larger impulse, that overlap is the kind of confluence worth marking on the chart
🐳 Pro Tip: A "B wave" that retraces more than 100% of A is not necessarily wrong — but the labels may need to move. Expanding flats are covered later in the course.
🔵 8. WHERE, AND WHEN
Fibonacci answers where might this leg reach. It does not answer has the turn actually happened. For that, most traders reach for something structural — and a trendline is the simplest version of it.
Two places it shows up in a wave sequence:
- Ending an impulse: a rising line along the pullback lows inside Wave 5. While it holds, the fifth wave is still building. When it gives way, the first corrective leg is often already underway — which is usually how a Wave A gets identified in real time rather than in hindsight
- Ending a correction: a descending line along the highs of the A-B-C. A break above it can be the first sign the correction may be complete, and it tends to arrive before any wave label can be confirmed
The rising line that had been holding the pullbacks inside Wave 5 gave way shortly after the high. The projection had already marked the area; the break is what turned it into something you could act on.
Neither break confirms a count on its own. What they add is timing — the projection gives you the area, the break gives you a moment to react to.
The same idea applied to the correction. While this descending line holds, the A-B-C can still be extending; a decisive move above it would be the first structural argument that the correction may be finishing.
🐳 Pro Tip: The projection and the trendline break rarely happen at the same instant. When the break comes far from any zone you had marked, it is more likely noise. When it comes inside that zone, the two are describing the same event from different angles.
🔵 9. CONFLUENCE WITHOUT LEVEL-HUNTING
The risk with Fibonacci is that enough levels on a chart will eventually cover every price. A few habits keep it disciplined.
1. Draw only the measurement the current question needs — one retracement or one projection, not five
2. Prefer zones where a Fib level overlaps something independent: a horizontal level from prior structure, a channel boundary, a moving average
3. Keep the invalidation levels from Lesson 4 visible at all times
4. Remove drawings that belong to a count you have already discarded
A level that matters usually has a reason to matter beyond the ratio itself.
🐳 Pro Tip: Horizontal levels built from prior structure are useful here precisely because they come from something other than wave ratios. When a retracement zone lands on a level that was already on the chart before you measured anything, the two are agreeing independently — a more meaningful kind of agreement than stacking more ratios on top of each other.
🔵 COMMON MISTAKES
- Using a retracement where a three-point projection is needed, or the reverse
- Anchoring a Wave 3 projection at the start of Wave 1 instead of the end of Wave 2
- Treating a ratio hit as confirmation while a rule from Lesson 4 is already broken
- Discarding a valid count because a retracement came in shallower or deeper than expected
- Leaving every Fibonacci level on the chart until nothing stands out
- Expecting exact touches — ratios describe zones, and overshoots are normal
- Adjusting the anchors after the fact so the level matches where price already went
🔵 QUICK SELF-CHECK
- Explain in one sentence when you would use a retracement and when you would use a projection
- Open a completed impulse and measure how much of Wave 1 the second wave gave back
- On the same chart, check where Wave 3 landed relative to 1.618 and 2.618
- Project Wave 5 from the Wave 4 low and see how close equality came to the actual high
- Draw the line along the Wave 5 pullback lows and find where it broke
- Identify the single level that would invalidate the count
🔵 WHAT IS NEXT
Lesson 7 — Extended Waves: one motive wave in an impulse is usually longer than the others. We look at which wave tends to extend, what changes when it does, and how the measurements in this lesson shift once an extension is underway.
Which Fibonacci measurement do you rely on most — and which one has misled you?
Full Trading Roadmap | Wave Analysis Course
Trading Roadmap | Wave Analysis · Lesson 01 — Wave Analysis Foundations
Trading Roadmap | Wave Analysis · Lesson 02 — Impulse Waves (5-Wave Structure)
Trading Roadmap | Wave Analysis · Lesson 03 — Corrective Waves (A-B-C)
Trading Roadmap | Wave Analysis · Lesson 04 — The Rules of Elliott
Trading Roadmap | Wave Analysis · Lesson 05 — Wave Personality
Best Regards, BigBeluga 🐳

🌐 bigbeluga.org/tv - Get access to our powerful tools & indicators.
🔵 Learn More -> docs.bigbeluga.org/
🔵 Join Discord -> go.bigbeluga.org/k65q9bfqfu
All content provided by BigBeluga is for educational purposes only
🔵 Learn More -> docs.bigbeluga.org/
🔵 Join Discord -> go.bigbeluga.org/k65q9bfqfu
All content provided by BigBeluga is for educational purposes only
関連の投稿
免責事項
これらの情報および投稿は、TradingViewが提供または承認する金融、投資、取引、またはその他の種類の助言もしくは推奨であることを意図したものではなく、またこれらに該当するものでもありません。詳細は利用規約をご覧ください。
🌐 bigbeluga.org/tv - Get access to our powerful tools & indicators.
🔵 Learn More -> docs.bigbeluga.org/
🔵 Join Discord -> go.bigbeluga.org/k65q9bfqfu
All content provided by BigBeluga is for educational purposes only
🔵 Learn More -> docs.bigbeluga.org/
🔵 Join Discord -> go.bigbeluga.org/k65q9bfqfu
All content provided by BigBeluga is for educational purposes only
関連の投稿
免責事項
これらの情報および投稿は、TradingViewが提供または承認する金融、投資、取引、またはその他の種類の助言もしくは推奨であることを意図したものではなく、またこれらに該当するものでもありません。詳細は利用規約をご覧ください。