
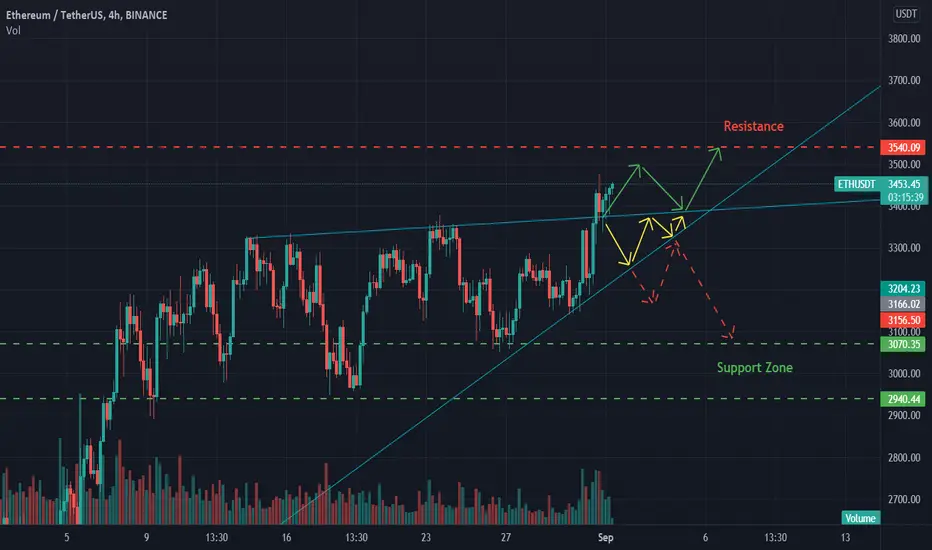
ETH has broken out from the triangle pattern and retested. As the volume spike is not much the breakout arouses suspicion.
It can continue the rally where 3540 could act as a strong resistance (based on previous price action) further rally can be seen if it breaks the same. Meanwhile, The short-term support zone can be seen around 2900-3070. Breaking this could trigger a large downside. Unless the price dips below support zone, the current bull run is intact and long positions can be continued. If this is is a false breakout, the price could move inside the triangle pattern or even break the lower trendline and even correct based on market conditions.
Note: The price action of ETH can be influenced and affected by Bitcoin, so Kindly refer to BTC Technicals. This is not an investment Advice, Do Your Own Research Before Taking Trades/Investing.
トレード終了: 利益確定目標に到達

免責事項
これらの情報および投稿は、TradingViewが提供または承認する金融、投資、取引、またはその他の種類の助言もしくは推奨であることを意図したものではなく、またこれらに該当するものでもありません。詳細は利用規約をご覧ください。
免責事項
これらの情報および投稿は、TradingViewが提供または承認する金融、投資、取引、またはその他の種類の助言もしくは推奨であることを意図したものではなく、またこれらに該当するものでもありません。詳細は利用規約をご覧ください。