
Ethereum / TetherUS (ETHUSDT) — D1
Potential Wave 3 Formation + Trendline Breakout
Bearish Continuation Scenario
🔎 Market Structure — D1
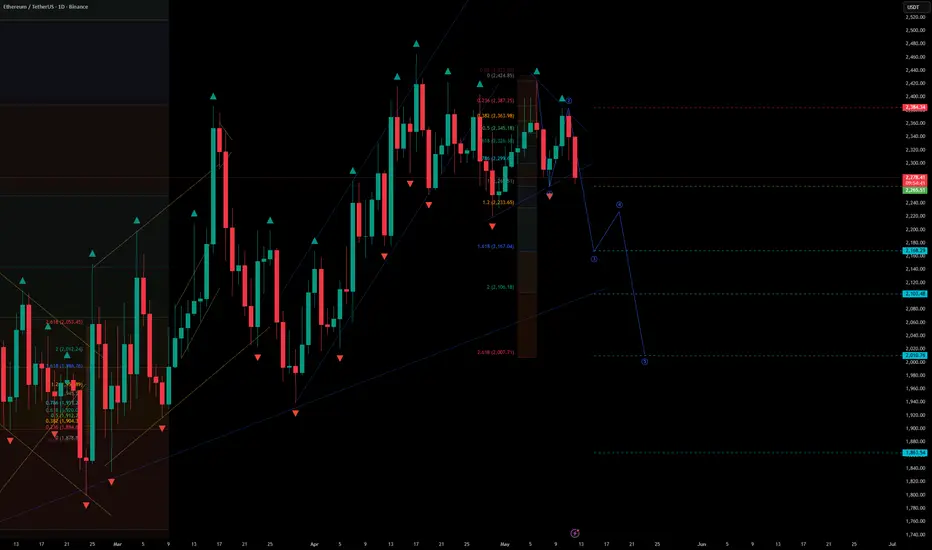
On the daily timeframe, ETHUSDT is showing a potential bearish continuation setup after breaking below the local ascending trendline.
The price reacted from the upper part of the structure and failed to sustain bullish momentum, which increases the probability of a downside continuation.
Key technical signals:
breakdown of the local trendline
rejection from the corrective high area
completion of a potential Wave 2 correction
loss of short-term bullish structure
bearish impulse activation below the local support zone
The current setup aligns with an Elliott Wave continuation model, where Wave 3 may begin after price exits the corrective structure.
📐 Elliott Wave Context
Wave 1: initial bearish impulse
Wave 2: corrective retracement toward resistance
Wave 3: potential active bearish expansion
📌 Key principle:
The bearish scenario remains valid as long as ETH stays below the high of Wave 2.
A breakout above this level would invalidate the current bearish setup and may indicate a shift toward an alternative bullish scenario.
📍 Entry
Entry: 2,265.51
The entry is positioned:
below the broken ascending trendline
after rejection from the local resistance zone
within the bearish impulse activation area
with invalidation placed above the Wave 2 high
🎯 Target Levels — Wave 3 Projections
Targets are based on the projected bearish impulse structure and Fibonacci extension zones:
TP1: 2,168.29
TP2: 2,103.48
TP3: 2,010.76
TP4: 1,863.54
Each target represents a potential reaction zone where partial profit-taking or temporary consolidation may occur during the development of Wave 3.
🛑 Invalidation / Stop Loss
Stop Loss: 2,384.34
The stop is placed above the high of Wave 2, which:
protects the setup from invalidation
confirms that the bearish Wave 3 scenario is no longer valid if breached
keeps risk clearly defined above the corrective high
avoids premature invalidation inside normal market noise
📊 Risk / Reward Overview
Entry: 2,265.51
Stop: 2,384.34
Risk: approximately 5.25%
Target potential:
TP1: approximately 4.29% downside / RR ≈ 0.82
TP2: approximately 7.15% downside / RR ≈ 1.36
TP3: approximately 11.24% downside / RR ≈ 2.14
TP4: approximately 17.74% downside / RR ≈ 3.38
🧠 Risk & Trade Management
This is a bearish trend-following setup based on the potential start of Wave 3 on the daily timeframe.
Recommended management approach:
monitor reaction around TP1, as the first target has a lower RR profile
consider partial profit-taking from TP2 onward
reduce risk after confirmation of downside continuation
move stop to breakeven only after a clear bearish impulse develops
avoid adding to the position after extended downside candles
scaling should only be considered on controlled intrawave pullbacks
📌 Summary
ETHUSDT on D1 is forming a potential Wave 3 bearish continuation setup after a local trendline breakout and rejection from the corrective high.
The bearish scenario remains active below 2,384.34, with downside targets at 2,168.29, 2,103.48, 2,010.76, and 1,863.54.
The setup is invalidated if price breaks above the Wave 2 high.
Potential Wave 3 Formation + Trendline Breakout
Bearish Continuation Scenario
🔎 Market Structure — D1
On the daily timeframe, ETHUSDT is showing a potential bearish continuation setup after breaking below the local ascending trendline.
The price reacted from the upper part of the structure and failed to sustain bullish momentum, which increases the probability of a downside continuation.
Key technical signals:
breakdown of the local trendline
rejection from the corrective high area
completion of a potential Wave 2 correction
loss of short-term bullish structure
bearish impulse activation below the local support zone
The current setup aligns with an Elliott Wave continuation model, where Wave 3 may begin after price exits the corrective structure.
📐 Elliott Wave Context
Wave 1: initial bearish impulse
Wave 2: corrective retracement toward resistance
Wave 3: potential active bearish expansion
📌 Key principle:
The bearish scenario remains valid as long as ETH stays below the high of Wave 2.
A breakout above this level would invalidate the current bearish setup and may indicate a shift toward an alternative bullish scenario.
📍 Entry
Entry: 2,265.51
The entry is positioned:
below the broken ascending trendline
after rejection from the local resistance zone
within the bearish impulse activation area
with invalidation placed above the Wave 2 high
🎯 Target Levels — Wave 3 Projections
Targets are based on the projected bearish impulse structure and Fibonacci extension zones:
TP1: 2,168.29
TP2: 2,103.48
TP3: 2,010.76
TP4: 1,863.54
Each target represents a potential reaction zone where partial profit-taking or temporary consolidation may occur during the development of Wave 3.
🛑 Invalidation / Stop Loss
Stop Loss: 2,384.34
The stop is placed above the high of Wave 2, which:
protects the setup from invalidation
confirms that the bearish Wave 3 scenario is no longer valid if breached
keeps risk clearly defined above the corrective high
avoids premature invalidation inside normal market noise
📊 Risk / Reward Overview
Entry: 2,265.51
Stop: 2,384.34
Risk: approximately 5.25%
Target potential:
TP1: approximately 4.29% downside / RR ≈ 0.82
TP2: approximately 7.15% downside / RR ≈ 1.36
TP3: approximately 11.24% downside / RR ≈ 2.14
TP4: approximately 17.74% downside / RR ≈ 3.38
🧠 Risk & Trade Management
This is a bearish trend-following setup based on the potential start of Wave 3 on the daily timeframe.
Recommended management approach:
monitor reaction around TP1, as the first target has a lower RR profile
consider partial profit-taking from TP2 onward
reduce risk after confirmation of downside continuation
move stop to breakeven only after a clear bearish impulse develops
avoid adding to the position after extended downside candles
scaling should only be considered on controlled intrawave pullbacks
📌 Summary
ETHUSDT on D1 is forming a potential Wave 3 bearish continuation setup after a local trendline breakout and rejection from the corrective high.
The bearish scenario remains active below 2,384.34, with downside targets at 2,168.29, 2,103.48, 2,010.76, and 1,863.54.
The setup is invalidated if price breaks above the Wave 2 high.

免責事項
これらの情報および投稿は、TradingViewが提供または承認する金融、投資、取引、またはその他の種類の助言もしくは推奨であることを意図したものではなく、またこれらに該当するものでもありません。詳細は利用規約をご覧ください。
免責事項
これらの情報および投稿は、TradingViewが提供または承認する金融、投資、取引、またはその他の種類の助言もしくは推奨であることを意図したものではなく、またこれらに該当するものでもありません。詳細は利用規約をご覧ください。