ロング
ETPUSD is in a very strong bullish trend
Hello guys,
looking for something of interesting to trade during these extremely boring trading days I came across this token appearing quite intersting.
Due to the small volatility of these days is necessary to narrow time frame: in this cases I generally use a 2 hours time frame, not too long and not too short.
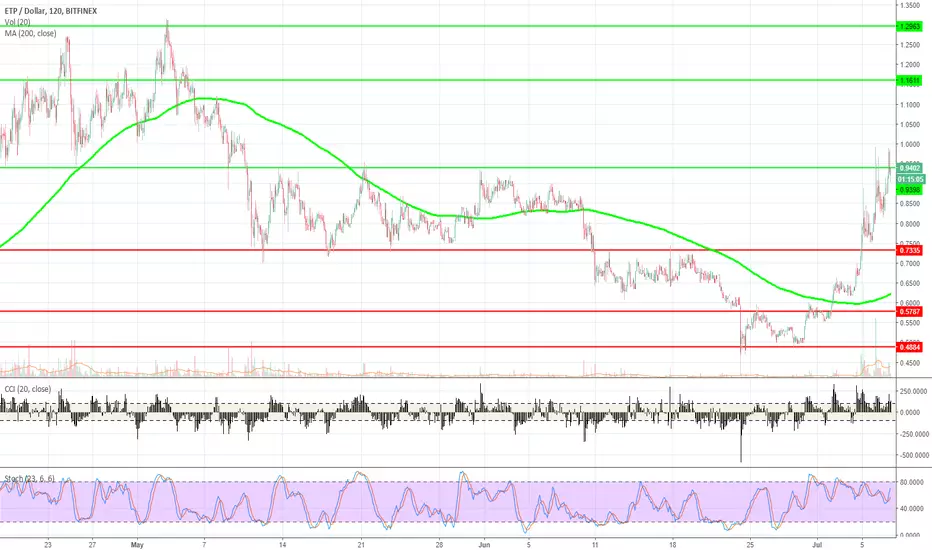
From this chart we can see ETPUSD in a good bullish trend:at the moment prices are consoliding above the resistance between 0.93 USD and 0.94 USD (R1). This consolidation is usefull to relieve the indicators to prepare a possible bullish spike. Volume are quite good if compared to historical data reguarding this crypto and in respect to the actual market.
If prices are able to remain near or just above this resistance, favoring a "recharge" of indicators, we can see in next days a possible new run to resistance area between 1.15/1.18 USD (R2) and then to 1.30 USD (R3). If ETP would changing trend can come back to 0.85 USD (S1), where passes the 200 MA calculated on 15 minutes time frame, and then to 0.73 USD (S2) where we find an important supportive area.
To summarize:
if prices remain steadily above area R1: 0.93/0.94 USD ----> R2: 1.15/1.18 USD ----> R3: 1.30 USD
If prices falls S1: 0.85 USD ----> S2: 0.73 USD
***This analysis is not a buy or sell advice, it is drawn up for educational purpose only***
looking for something of interesting to trade during these extremely boring trading days I came across this token appearing quite intersting.
Due to the small volatility of these days is necessary to narrow time frame: in this cases I generally use a 2 hours time frame, not too long and not too short.
From this chart we can see ETPUSD in a good bullish trend:at the moment prices are consoliding above the resistance between 0.93 USD and 0.94 USD (R1). This consolidation is usefull to relieve the indicators to prepare a possible bullish spike. Volume are quite good if compared to historical data reguarding this crypto and in respect to the actual market.
If prices are able to remain near or just above this resistance, favoring a "recharge" of indicators, we can see in next days a possible new run to resistance area between 1.15/1.18 USD (R2) and then to 1.30 USD (R3). If ETP would changing trend can come back to 0.85 USD (S1), where passes the 200 MA calculated on 15 minutes time frame, and then to 0.73 USD (S2) where we find an important supportive area.
To summarize:
if prices remain steadily above area R1: 0.93/0.94 USD ----> R2: 1.15/1.18 USD ----> R3: 1.30 USD
If prices falls S1: 0.85 USD ----> S2: 0.73 USD
***This analysis is not a buy or sell advice, it is drawn up for educational purpose only***
トレード終了: 利益確定目標に到達
First target reached in 3 hours...トレード終了: 利益確定目標に到達
Also the second target is reached: with a small part of initial position is possible to wait for the 200 daily MA, passes at 1.5 USDトレード終了: 利益確定目標に到達
All position closed
免責事項
これらの情報および投稿は、TradingViewが提供または承認する金融、投資、取引、またはその他の種類の助言もしくは推奨であることを意図したものではなく、またこれらに該当するものでもありません。詳細は利用規約をご覧ください。
免責事項
これらの情報および投稿は、TradingViewが提供または承認する金融、投資、取引、またはその他の種類の助言もしくは推奨であることを意図したものではなく、またこれらに該当するものでもありません。詳細は利用規約をご覧ください。