

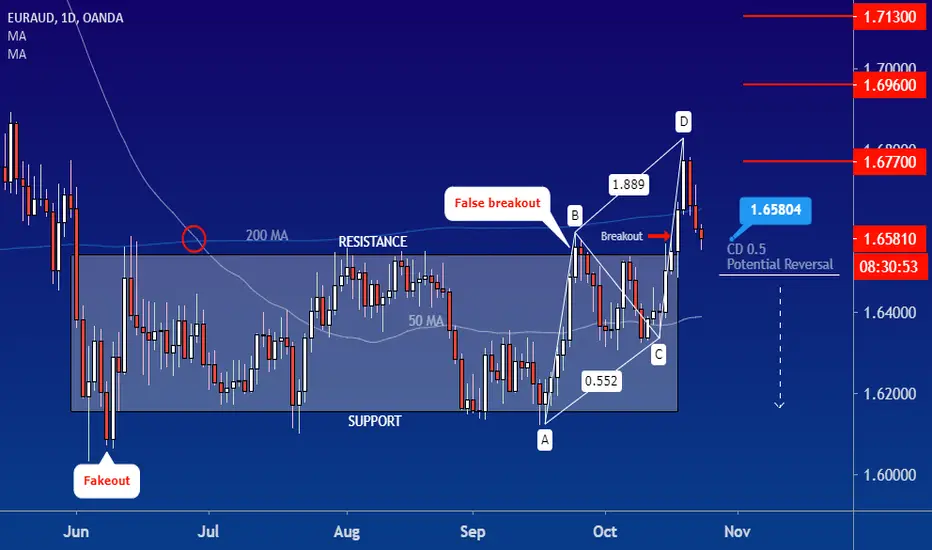
From the beginning of June, EUR/USD made a rectangle, and it's broke this channel between points C & D. Here, I have used the ABCD pattern to set the levels. C point is 0.5, and the BC projection is 2. From D point, it fell. It will bounce from the potential reversal point, and it will reach the following target 1.67700 - 1.69600 -1.71300.
But if it breaks the potential reversal, it will fall and hit the following levels 1.64160 - 1.63210 - 1.61765.
But if it breaks the potential reversal, it will fall and hit the following levels 1.64160 - 1.63210 - 1.61765.

関連の投稿
免責事項
これらの情報および投稿は、TradingViewが提供または承認する金融、投資、取引、またはその他の種類の助言もしくは推奨であることを意図したものではなく、またこれらに該当するものでもありません。詳細は利用規約をご覧ください。
免責事項
これらの情報および投稿は、TradingViewが提供または承認する金融、投資、取引、またはその他の種類の助言もしくは推奨であることを意図したものではなく、またこれらに該当するものでもありません。詳細は利用規約をご覧ください。