

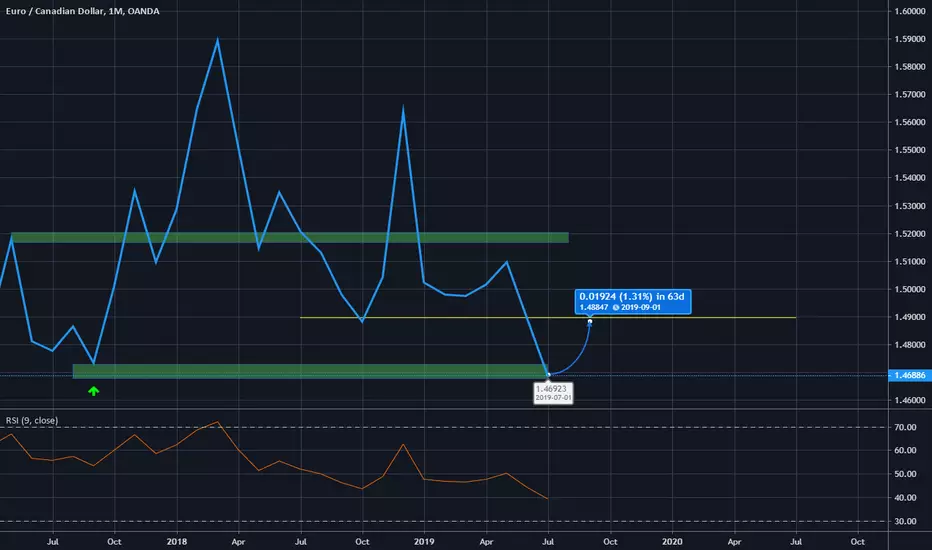
The Support Level is hard to see on the daily and even weekly chart, but it does exist! This is a monthly support level!
so.....
1. Daily Chart Came Down To Monthly Support and moved up , and then CAME DOWN again and RETESTED the Montly Support Area!
2. Indicators on hour 4 indicate a buy now!
So the Idea is that we are have entered a buy on the daily chart at a monthly support area and we ENTERED our trade on hour 4 to confirm this buy!
I hope this helps!
so.....
1. Daily Chart Came Down To Monthly Support and moved up , and then CAME DOWN again and RETESTED the Montly Support Area!
2. Indicators on hour 4 indicate a buy now!
So the Idea is that we are have entered a buy on the daily chart at a monthly support area and we ENTERED our trade on hour 4 to confirm this buy!
I hope this helps!

免責事項
これらの情報および投稿は、TradingViewが提供または承認する金融、投資、取引、またはその他の種類の助言もしくは推奨であることを意図したものではなく、またこれらに該当するものでもありません。詳細は利用規約をご覧ください。
免責事項
これらの情報および投稿は、TradingViewが提供または承認する金融、投資、取引、またはその他の種類の助言もしくは推奨であることを意図したものではなく、またこれらに該当するものでもありません。詳細は利用規約をご覧ください。