

Hello Traders!
Have you ever wondered when will a strong trend end? Do you struggle to spot candlestick patterns that potentially signal when the bulls or bears might take over?
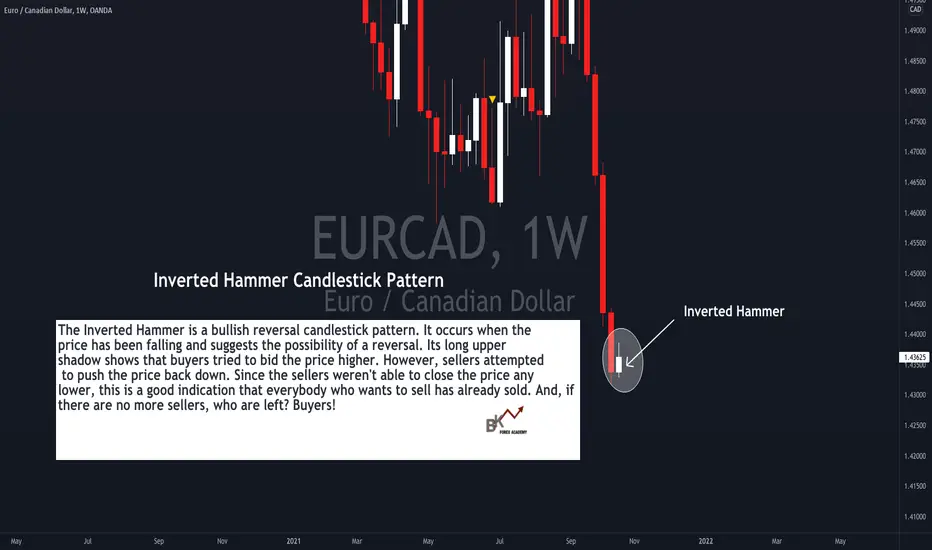
Take a look at this example of EUR/CAD and let's see how the trade plays out! :)
About the Inverted Hammer Candlestick Pattern and Why It Forms:
The Inverted Hammer is a bullish reversal candlestick pattern. It occurs when the price has been falling and suggests the possibility of a reversal. Its long upper
shadow shows that buyers tried to bid the price higher. However, sellers attempted to push the price back down. Since the sellers weren't able to close the price any
lower, this is a good indication that everybody who wants to sell has already sold. And, if there are no more sellers, who are left? Buyers!
And just an important observation, the Inverted Hammer has a small real body, and has a large upper shadow with a small or no lower shadow (also known as "wick").
Would you like to receive more "live charting" tutorials like this?? Comment below and let us know! :)
Happy Trading!

✅ BK WEALTH ACADEMY:
v2.stan.store/brianandkenya
✅ TELEGRAM:
t.me/briankenyahorton
✅ YOUTUBE:
youtube.com/@bktradingacademy
✅ BK KISS TRADING SCANNER:
bktradingacademy.com/bk-kiss-scanner
v2.stan.store/brianandkenya
✅ TELEGRAM:
t.me/briankenyahorton
✅ YOUTUBE:
youtube.com/@bktradingacademy
✅ BK KISS TRADING SCANNER:
bktradingacademy.com/bk-kiss-scanner
免責事項
これらの情報および投稿は、TradingViewが提供または承認する金融、投資、取引、またはその他の種類の助言もしくは推奨であることを意図したものではなく、またこれらに該当するものでもありません。詳細は利用規約をご覧ください。