

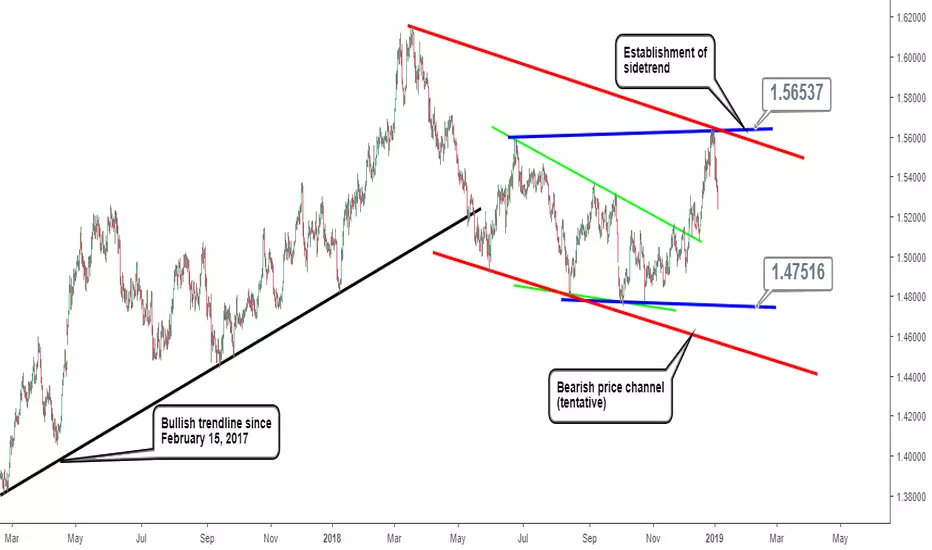
EURCAD analysis for today is carried out on a 6 hour timeframe that covers over 22 months of price action.
The bullish trendline in the EURCAD lasted over a year and 4 months before price closed below it for the first time on May 16, 2018 at ~ 1.52063, indicating a possible trend change.
The bearish swing in price from ~1.61405 to 1.47678 ended up with a falling wedge chart pattern that saw price break to the upside, terminating at 1.56537. This provides the basis to set up a sideways trend for the EURCAD and also a bearish channel (tentative) shown on the chart help to provide context for price action.
A break below 1.47516 could see price reach the bottom of the bearish channel and a close below the channel would imply acceleration of bearish momentum.
The bullish trendline in the EURCAD lasted over a year and 4 months before price closed below it for the first time on May 16, 2018 at ~ 1.52063, indicating a possible trend change.
The bearish swing in price from ~1.61405 to 1.47678 ended up with a falling wedge chart pattern that saw price break to the upside, terminating at 1.56537. This provides the basis to set up a sideways trend for the EURCAD and also a bearish channel (tentative) shown on the chart help to provide context for price action.
A break below 1.47516 could see price reach the bottom of the bearish channel and a close below the channel would imply acceleration of bearish momentum.

関連の投稿
免責事項
これらの情報および投稿は、TradingViewが提供または承認する金融、投資、取引、またはその他の種類の助言もしくは推奨であることを意図したものではなく、またこれらに該当するものでもありません。詳細は利用規約をご覧ください。
関連の投稿
免責事項
これらの情報および投稿は、TradingViewが提供または承認する金融、投資、取引、またはその他の種類の助言もしくは推奨であることを意図したものではなく、またこれらに該当するものでもありません。詳細は利用規約をご覧ください。