

1. The Macro Context (The "Why") 🌍
Hi traders! Before looking at the candles, let's look at the money.
My fundamental scoring table speaks clearly: there is a +5 differential, indicating a Bullish Moderate bias that we cannot ignore.
Key Factor Analysis:
🏦 Current Rates: Explanation: ECB at 2.15% (G7 average) vs SNB at 0% (lowest G7, no carry appeal). Score EUR: 0 Score CHF: -1
🌍 Economic Regime: Explanation: Both currencies are in a Reflation regime with moderate inflation increases. Score EUR: +1 Score CHF: +1
📊 Rate Expectations: Explanation: Both central banks are neutral, holding steady with no immediate pressure. Score EUR: 0 Score CHF: 0
🎈 Inflation: Explanation: EUR (2.14%) is near target, while CHF (0.02%) is in deflation and well below target. Score EUR: 0 Score CHF: -1
📈 Growth/GDP: Explanation: EUR shows evident stagnation (0.7%), while CHF shows modest but stable growth (1.2%). Score EUR: -1 Score CHF: 0
⚖️ Risk Sentiment: Explanation: The market is in a neutral regime for both currencies with no specific bias. Score EUR: 0 Score CHF: 0
🏛️ COT Score: Explanation: Strong long accumulation and accelerating buys for EUR vs consolidated strong shorts for CHF. Score EUR: +2 Score CHF: -1
🗞️ News Bonus: Explanation: No major EUR surprises; CHF PMI Manufacturing (48.8) remains in contraction despite a slight recovery. Score EUR: 0 Score CHF: -1
Currency Score Summary:
Total Score EUR: +2 (Neutral/Mixed)
Total Score CHF: -3 (Weak)
Synthesis:
EUR (Mixed, Score +2): ECB neutral with 2.15% rates, inflation near target but growth is weak. Strong COT support with speculators accumulating.
CHF (Very Weak, Score -3): SNB neutral with 0% rates and stagnation. Manufacturing PMI remains under 50 with consolidated short positions.
Conclusion: With this scenario, we are only looking for Long setups. Going against this bias would be statistical suicide.
2. The Technical Setup (The "Where") 📉
Timeframe: 15m | Pair: EUR/CHF
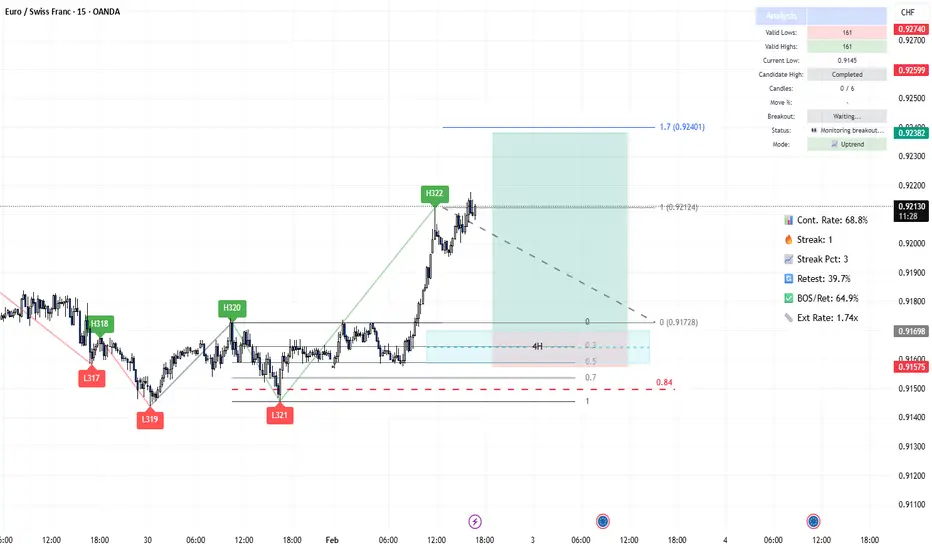
The SMC Market Structure + Price Zones [MaB] indicator gave us the confirmation we needed for our statistical edge.
Here is where the indicator makes the difference. Look at the dashboard on the right, numbers don't lie:
🚀 Continuation Rate (68.8%): We are well above the 60% threshold.
This tells us the market is in a healthy, directional trend. Statistically, betting on continuation pays off more than looking for a reversal.
🔥 Streak (1) & Streak Pct: We are at the 1st consecutive impulse.
It's a fresh trend (we are in the 3rd percentile of trend extension), so the potential for growth is high. As long as the music plays, we dance.
🔄 Retest (39.7%): The indicator tells us that statistically, when price creates a new Break of Structure (BOS), it retraces into the previous zone only 39.7% of the time.
💥 BOS/Ret Rate (64.9%): This parameter tells us that once price retraces inside the previous zone, it has a high probability of reacting and creating a new BOS.
🎯 Extension Rate (1.74x): The algorithm projects an ambitious target.
We expect this move to extend 1.74 times the current pullback leg. That's where we'll take profit.
3. Execution Plan on Chart
Moving to the chart, the SMC Market Structure + Price Zones [MaB] indicator supports us in pinpointing liquidity to define entry and stop loss:
Entry and Stop Loss: We place a limit entry in the Demand Zone 15m (Blue Band) and the stop loss a few pips below the zone.
Take Profit: We leverage the asset's statistical analysis offered by the Extension Rate and place the target by measuring with Fibonacci at 1.74x relative to the pullback leg.
Trade Parameters:
Entry Price: 0.91698
Stop Loss: 0.91575
Take Profit: 0.92382
⚠️ Disclaimer: This analysis is based on a proprietary algorithm and is shared exclusively for educational and didactic purposes. It does not constitute financial advice or investment solicitation in any way. Trading involves significant risk.
Hi traders! Before looking at the candles, let's look at the money.
My fundamental scoring table speaks clearly: there is a +5 differential, indicating a Bullish Moderate bias that we cannot ignore.
Key Factor Analysis:
🏦 Current Rates: Explanation: ECB at 2.15% (G7 average) vs SNB at 0% (lowest G7, no carry appeal). Score EUR: 0 Score CHF: -1
🌍 Economic Regime: Explanation: Both currencies are in a Reflation regime with moderate inflation increases. Score EUR: +1 Score CHF: +1
📊 Rate Expectations: Explanation: Both central banks are neutral, holding steady with no immediate pressure. Score EUR: 0 Score CHF: 0
🎈 Inflation: Explanation: EUR (2.14%) is near target, while CHF (0.02%) is in deflation and well below target. Score EUR: 0 Score CHF: -1
📈 Growth/GDP: Explanation: EUR shows evident stagnation (0.7%), while CHF shows modest but stable growth (1.2%). Score EUR: -1 Score CHF: 0
⚖️ Risk Sentiment: Explanation: The market is in a neutral regime for both currencies with no specific bias. Score EUR: 0 Score CHF: 0
🏛️ COT Score: Explanation: Strong long accumulation and accelerating buys for EUR vs consolidated strong shorts for CHF. Score EUR: +2 Score CHF: -1
🗞️ News Bonus: Explanation: No major EUR surprises; CHF PMI Manufacturing (48.8) remains in contraction despite a slight recovery. Score EUR: 0 Score CHF: -1
Currency Score Summary:
Total Score EUR: +2 (Neutral/Mixed)
Total Score CHF: -3 (Weak)
Synthesis:
EUR (Mixed, Score +2): ECB neutral with 2.15% rates, inflation near target but growth is weak. Strong COT support with speculators accumulating.
CHF (Very Weak, Score -3): SNB neutral with 0% rates and stagnation. Manufacturing PMI remains under 50 with consolidated short positions.
Conclusion: With this scenario, we are only looking for Long setups. Going against this bias would be statistical suicide.
2. The Technical Setup (The "Where") 📉
Timeframe: 15m | Pair: EUR/CHF
The SMC Market Structure + Price Zones [MaB] indicator gave us the confirmation we needed for our statistical edge.
Here is where the indicator makes the difference. Look at the dashboard on the right, numbers don't lie:
🚀 Continuation Rate (68.8%): We are well above the 60% threshold.
This tells us the market is in a healthy, directional trend. Statistically, betting on continuation pays off more than looking for a reversal.
🔥 Streak (1) & Streak Pct: We are at the 1st consecutive impulse.
It's a fresh trend (we are in the 3rd percentile of trend extension), so the potential for growth is high. As long as the music plays, we dance.
🔄 Retest (39.7%): The indicator tells us that statistically, when price creates a new Break of Structure (BOS), it retraces into the previous zone only 39.7% of the time.
💥 BOS/Ret Rate (64.9%): This parameter tells us that once price retraces inside the previous zone, it has a high probability of reacting and creating a new BOS.
🎯 Extension Rate (1.74x): The algorithm projects an ambitious target.
We expect this move to extend 1.74 times the current pullback leg. That's where we'll take profit.
3. Execution Plan on Chart
Moving to the chart, the SMC Market Structure + Price Zones [MaB] indicator supports us in pinpointing liquidity to define entry and stop loss:
Entry and Stop Loss: We place a limit entry in the Demand Zone 15m (Blue Band) and the stop loss a few pips below the zone.
Take Profit: We leverage the asset's statistical analysis offered by the Extension Rate and place the target by measuring with Fibonacci at 1.74x relative to the pullback leg.
Trade Parameters:
Entry Price: 0.91698
Stop Loss: 0.91575
Take Profit: 0.92382
⚠️ Disclaimer: This analysis is based on a proprietary algorithm and is shared exclusively for educational and didactic purposes. It does not constitute financial advice or investment solicitation in any way. Trading involves significant risk.

Trading indicators development focused on Smart Money Concepts (SMC), market structure analysis, and liquidity zones.
WEBSITE: mab-arreca.com/
WHOP: whop.com/mab-9cb1/
YOUTUBE: youtube.com/@MaB.arreca
WEBSITE: mab-arreca.com/
WHOP: whop.com/mab-9cb1/
YOUTUBE: youtube.com/@MaB.arreca
関連の投稿
免責事項
これらの情報および投稿は、TradingViewが提供または承認する金融、投資、取引、またはその他の種類の助言もしくは推奨であることを意図したものではなく、またこれらに該当するものでもありません。詳細は利用規約をご覧ください。
Trading indicators development focused on Smart Money Concepts (SMC), market structure analysis, and liquidity zones.
WEBSITE: mab-arreca.com/
WHOP: whop.com/mab-9cb1/
YOUTUBE: youtube.com/@MaB.arreca
WEBSITE: mab-arreca.com/
WHOP: whop.com/mab-9cb1/
YOUTUBE: youtube.com/@MaB.arreca
関連の投稿
免責事項
これらの情報および投稿は、TradingViewが提供または承認する金融、投資、取引、またはその他の種類の助言もしくは推奨であることを意図したものではなく、またこれらに該当するものでもありません。詳細は利用規約をご覧ください。